Skip to content

What Is a Good Customer LTV for a Shopify Store?

A good customer LTV for a Shopify store is typically $168 over 3 years on average, with top performers reaching $250-$450 or more. Aim for at least a 3:1 LTV: CAC ratio to scale profitably.

Most business founders track revenue daily but often don’t measure how much a customer is worth over time. Without LTV, acquisition decisions become guesswork and margins quietly compress as ad costs rise. Understanding and improving LTV helps you make smarter decisions and grow more profitably

WHAT YOU’LL LEARN 

  • What LTV actually means and the right way to calculate it
  • 2026 benchmarks by vertical: apparel, beauty, supplements, food and home goods
  • Why the gap between top and bottom performers is wider than you think
  • Four levers that move LTV the fastest

What Is Customer LTV?What Is Customer LTV?

Customer lifetime value (LTV) is the total revenue a customer generates across their relationship with your store. It sets the ceiling for what you can pay to acquire a customer while staying profitable.

If the average customer is worth $180 over 12 months and you spend $60 to acquire them, your unit economics work. If LTV is $80 and CAC is $65, you’re near break even on the first purchase and dependent on a second order that may not come.

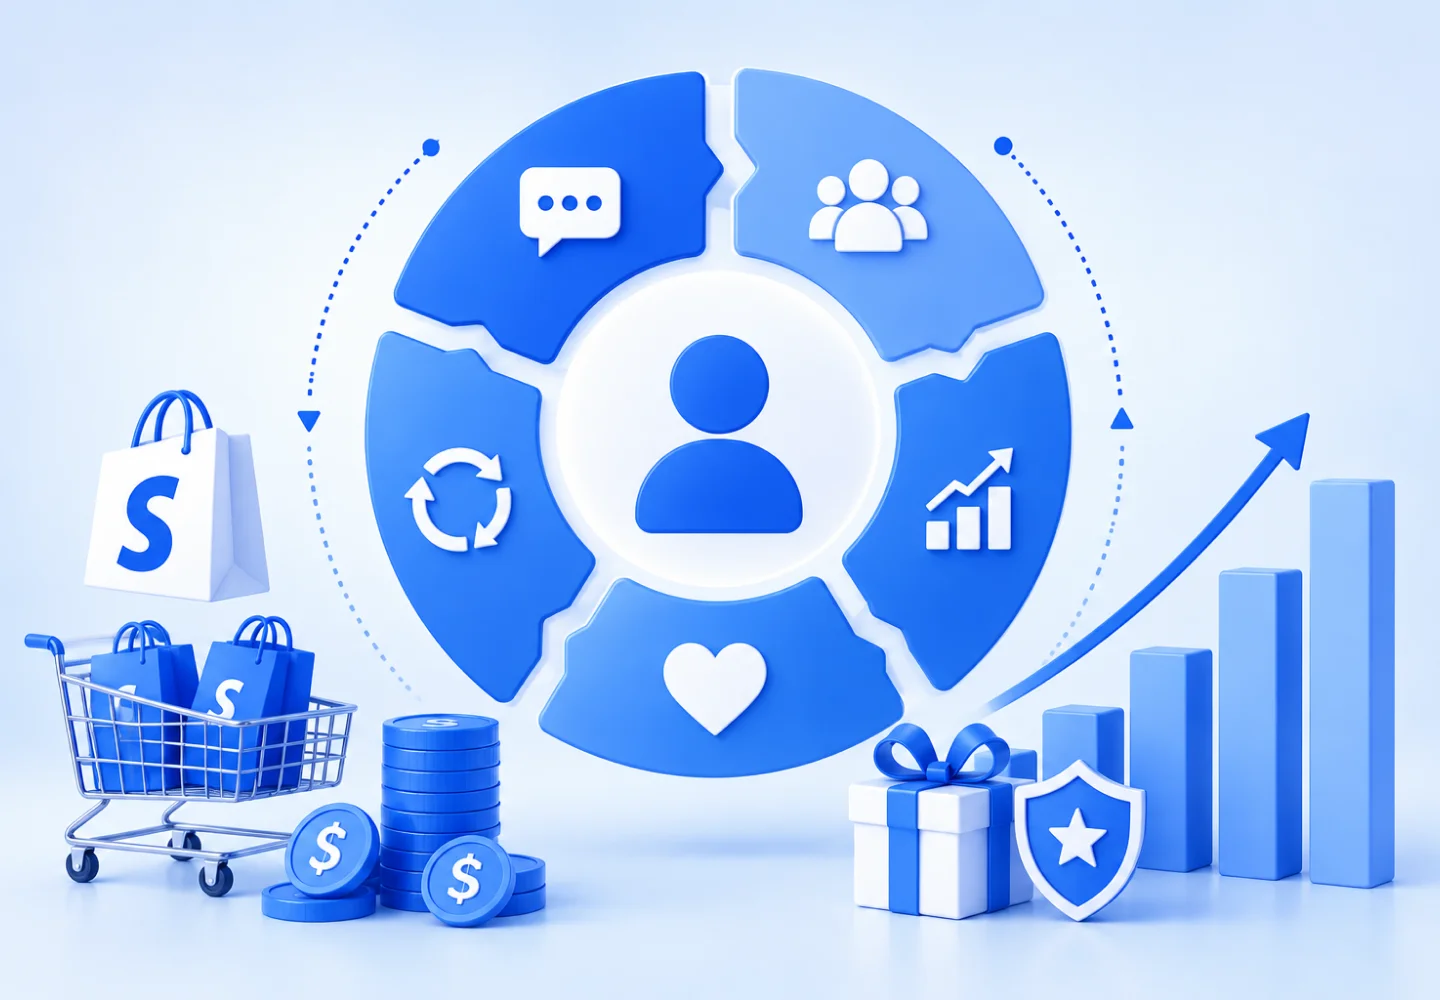
Why Customer LTV is Important? 
Why Customer LTV is Important?

LTV shows how much you can spend to get a new customer without losing money. Without it, you’re guessing on ad budgets and may be spending too much or too little. It also helps you see which channels bring valuable customers and which ones waste your money on buyers who never come back.

It also pushes you to think long term. Instead of chasing quick sales, you start focusing on keeping customers and getting them to buy again. If your LTV is less than three times what you spend to acquire a customer, scaling ads will hurt more than help. Knowing your LTV lets you grow without the guesswork.

How to Calculate LTV of a Customer?

Getting LTV right means moving beyond rough estimates and building a formula you can trust. Too many store owners grab a single number from their dashboard without understanding what sits behind it.

A proper calculation gives you a solid foundation for every customer acquisition and retention decision you make. To calculate customer LTV, follow these steps:

1. Choose a Consistent Time Window

Most eCommerce teams settle on a 3 year revenue window because it balances long term insights with practical data availability. Shorter windows undercount value; longer ones introduce too much uncertainty.

2. Use the Driver Model

Customer LTV formula is:

LTV= Average Order Value x Purchase Frequency x Customer Lifespan

Here’s what each part means:

  • Average Order Value (AOV): How much a customer spends per order on average.
  • Purchase Frequency: How many times a customer buys from you per year.
  • Customer Lifespan: How many years a customer stays active with your store.

This structure shows exactly which variable is dragging or driving your number.

Quick example,

Let’s say your store has three numbers:

  • Average order value: $80
  • Purchases per year: 2.5
  • Customer lifespan: 3 years

Your LTV would be: $80 x 2.5 x 3 = $600

This means the average customer brings in $600 over their connection with your store. Now you know how much you can spend to acquire them and make a profit.

3. Segment by Channel and Cohort

Beneded averages hide your best and worst performers. Pull LTV separately for paid search, paid social, email, organic and affiliates. You’ll often find one channel delivering twice the customer value of another at similar CAC.

4. Sanity Check with Payback Period

Make sure your Customer Acquisition Cost (CAC) is recovered within a reasonable window, typically 3-6 months for direct to consumer brands. If payback beyond that, cash flow tightens and scaling becomes risky, even with strong long term LTV.

Average Customer LTV by Shopify Industry (2026)

Average LTV varies significantly by what you sell. A supplement brand with a 90 day replenishment cycle will naturally generate higher LTV than a furniture brand where customers buy once every few years. The benchmarks below use a 3-year revenue-based window, which is the most common standard in e-commerce.

Why the Gap Between Top and Bottom Performers Is So Wide? 

The difference between a $90 LTV store and a $400 LTV store in the same vertical usually comes down to two things: repeat purchase rate and email marketing effectiveness. Stores with advanced email programmes see 35–45% higher LTV than those without. Email subscribers specifically average 3x higher LTV, not because email is magic, but because it keeps your brand present during the repurchase window.

How to Increase Customer LTV?

You don’t need to overhaul your entire business to increase LTV. Most improvements come from focusing on a few high impact areas that deliver results over time.

Here are the 4 important ways to increase customer lifetime value:

Increase Average Order Value 

Every dollar added to AOV compounds across every future purchase. A customer who spends $90 instead of $75 on each order generates 20% more LTV without buying any more frequently. Upsells at checkout, bundle offers, and free shipping thresholds above your current AOV are the fastest AOV levers.

Improve Purchase Frequency

The average Shopify store achieves around 1.8–2.2 purchases per customer per year. Moving that to 2.8 is worth more than a 30% price increase. Post purchase email flows, replenishment reminders, and seasonal re-engagement campaigns all drive frequency.

Extend Customer Lifespan 

A loyalty programme that gives customers a reason to keep choosing you over the next competitor offer extends the active lifespan of a customer relationship. Loyalty members average 28% higher retention rates and 18% higher AOV, both of which directly increase LTV.

Build Your Email List Aggressively 

Email subscribers have 3x higher LTV than non-subscribers on average. Every visitor to your store who leaves without giving you their email is a customer you might never speak to again. Capture emails at every opportunity,  post-purchase, exit intent, and during promotions.

What is the Difference Between LTV and CAC Ratio?

LTV and CAC are two separate numbers that work together to show your store’s health. LTV measures customer value, while CAC measures acquisition cost. The ratio between them tells you if your growth is profitable or burning cash.

Aspect LTV (Customer Lifetime Value) CAC (Customer Acquisition Cost)
What it measures Total revenue a customer brings over time Cost to acquire one new customer
Formula AOV x Purchase Frequency x Customer Lifespan Total Marketing Spend ÷ New Customers Acquired
Focus Customer value and retention Marketing efficiency and spend
Goal Increase through repeat purchases and loyalty Decrease through better targeting and conversion
Time frame Long term (months to years) Short term (per campaign or period)
What it tells you How much a customer is worth to your business How much you pay to bring that customer in.

The LTV to CAC Ratio

The ratio shows how your customer value compares to your acquisition cost. A healthy ratio is 3:1 or higher, meaning each customer is worth at least three times what you spent to acquire them. If your ratio falls below 2:1, you are likely spending too much on acquisition or not earning enough from each customer over time.

Closing Thoughts

LTV is the compass for profitable growth. Many Shopify brands leave meaningful LTV untapped, not due to weak products, but due to gaps after the first purchase. A disciplined email program, a straightforward loyalty structure and clear LTV by channel will raise customer value faster than any acquisition tactic.

Key Takeaways 

  • The average Shopify store LTV is $168 over 3 years. Top performers commonly reach $250-$450 and more.
  • Supplements and health brands lead LTV due to strong replenishment and subscriptions
  • Email subscribers often deliver around 3x higher LTV than non subscribers.
  • The first 90 days after purchase matter most. Customers who buy again within the window are far likelier to become long term buyers.
  • LTV is driven by AOV, purchase frequency and lifespan. Improve any one and LTV rises.
  • Loyalty members commonly show higher retention and higher AOV, both lifting LTV.
  • Always segment LTV by acquisition channel. Blended figures hide your best and worst sources.
  • If LTV is below 3x CAC, fix unit economics before scaling ad spend.

Know What Your Customers Are Actually Worth

DataAnalyticsStack builds Customer Analytics dashboards that track LTV, retention, and repeat purchase rate in one place. You’ll see which customers to acquire more of and which channels are actually profitable.

Contact Us

What Is a Shopify Analytics Dashboard and Why Your Store Needs It

Are you running a Shopify store but still guessing what’s working and what’s not? A Shopify Analytics Dashboard shows your sales, customers, traffic, and product performance in one place, so you can make smarter decisions, fix weak spots, and grow your store with real data.

Key Highlights:

  • A Shopify Analytics Dashboard helps you track sales, traffic, and customer behavior clearly
  • It shows what products make money and what products waste your time
  • Small tracking changes can improve profit without increasing your ad spend

Let’s be honest for a second. Shopify is one of the easiest ways to launch an online store. You can set up products, choose a theme, and start selling fast. But after the first few days or weeks, many store owners hit the same problem.

Sales can feel random. One day you get orders. The next day, nothing happens. So you try ads. You post on Instagram. You change prices. Still, deep down, you don’t know what is really driving results.

That’s exactly why a Shopify Analytics Dashboard matters. It shows you what brings sales, what slows sales down, and what needs fixing first. So your decisions come from real numbers, not assumptions.

In this blog, I’ll explain what a Shopify Analytics Dashboard is, what it shows you, why it matters, and how it helps you make better business decisions even if you are not a “data person.”

What is a Shopify Analytics Dashboard?

A Shopify Analytics Dashboard is the reporting section inside Shopify that shows your store’s performance in a clean and simple way. It helps you understand what is happening in your store without needing spreadsheets or advanced tracking skills.

Instead of guessing why sales go up or down, Shopify shows you clear numbers like:

  • Total sales
  • Orders
  • Conversion rate
  • Average order value
  • Website sessions (traffic)
  • Returning customers
  • Best selling products

To make it easier, think of your Shopify store like a small shop that stays open every day. People visit your site. Some browse your products. Others scroll through pages and compare items. Many add products to the cart. Sometimes they buy. Other times, they leave.

And that’s normal.

The real problem starts when you don’t track those actions. Because if you don’t track them, you never know what’s working. You only guess.

That’s exactly where the Shopify Analytics Dashboard helps. It follows what customers do inside your store, step by step. So instead of trusting feelings, you can trust real numbers.

In the end, it helps you run your store like a real business, not like a gamble.

Why does your Shopify store need an analytics dashboard?

A lot of people start selling online with one simple mindset: “Let me add products and see what happens.” And honestly, that works in the beginning.

Still, after a few weeks, guessing stops feeling helpful. At that stage, you need direction. You need real proof. Most importantly, you need to know what to fix next.

That’s where a Shopify Analytics Dashboard becomes important. It turns your daily store activity into clear numbers, so you can make smart changes instead of random ones.

It helps you stop making blind decisions

Without analytics, most store decisions feel like guesses.

For example, you keep asking questions like:

  • Do I run ads again or pause for now?
  • Should I lower prices to get more sales?
  • Is this product worth keeping?
  • Does my homepage need a change?
  • Should I try bundles to raise my order value?

Now imagine answering these questions with real data instead of guessing.

That’s the difference analytics makes. It gives you clarity and helps you choose based on what customers actually do, not what you think they do.

It shows what’s really making you money

This part surprises many Shopify owners. Most stores don’t earn money from every product equally. In fact, a few products often carry the whole store.

Sometimes it looks like this:

  • 1 product brings most sales
  • 2–3 products bring most profit
  • The rest barely move

A Shopify Analytics Dashboard helps you spot your winners fast.

So instead of wasting energy on products that don’t sell, you can focus on what already works. And once you push the right product harder, growth feels easier.

It helps you fix problems before they get worse

Some store problems grow quietly. You don’t notice them right away.

For example:

  • Traffic starts dropping
  • Conversion rate goes down
  • Refunds increase
  • Cart abandonment rises

At first, nothing feels “wrong.” Then one day you realize sales fell, and you don’t know why.

That’s the risky part.

But when you check your Shopify Analytics Dashboard, you can catch issues earlier. Then you can fix them before they turn into a bigger mess.

How does a Shopify Analytics Dashboard help you grow faster?

Growth doesn’t always mean adding more products or spending more on ads. Sometimes real growth comes from fixing one weak step in your store. And the dashboard helps you find that step.

For example, you might notice things like:

  • You get traffic, but checkout conversions stay low
  • People add to cart, but don’t complete the purchase
  • You get orders, but refunds keep rising
  • You make sales, but customers don’t come back

Once you spot the real problem, the solution becomes clearer.

That’s why the Shopify Analytics Dashboard is not just a reporting screen. It works like a growth tool, because it shows you what to improve next.

What metrics should you track inside Shopify Analytics?

Shopify shows many numbers. So it can feel confusing at first. However, you don’t need to track everything. You only need to track what helps you make decisions.

Here are the most important Shopify analytics metrics, explained in a simple way.

1. Total Sales (your store’s main scoreboard)

Total sales show how much money your store made in a set time. This matters because it shows growth or decline. But don’t stop here.

Sales alone don’t explain why things changed. So always connect it with other metrics too.

2. Orders (how many purchases happened)

Orders show how many customers bought something. This tells you a lot. It shows if sales come in consistently. It also shows if visitors turn into customers. And over time, it helps you spot if your store has real momentum.

For example: You could have high sales but low orders because one person bought a big bundle. Or you could have medium sales but high orders because many people bought small items.

Both situations need different strategies.

3. Conversion rate (the “reality check” metric)

Conversion rate shows the percentage of visitors who buy. This metric matters because it answers one main question:

Are people trusting your store enough to purchase?

If your conversion rate feels low, the problem could be:

  • Weak product pages
  • Low trust
  • Slow website
  • High shipping cost
  • Confusing checkout
  • Unclear offer

Shopify conversion rate shows you if your store feels healthy or stuck.

4. Average Order Value (AOV)

AOV is the average amount a customer spends per order. This helps you understand profit growth. Because if your AOV rises, you can earn more without getting more traffic.

Ways to increase AOV include:

  • Bundles
  • Free shipping thresholds
  • Upsells
  • “buy 2 get 1” deals
  • Product add ons

A good Shopify Analytics Dashboard helps you track if these offers work.

5. Sessions (how much traffic your store gets)

Sessions show how many visits your store received. Traffic matters because it shows demand. But traffic is not a success by itself. You could have 5,000 visitors and still make zero sales if your store feels confusing.

That’s why sessions should be tracked with conversion rate.

6. Returning customer rate (your long term growth signal)

Returning customers mean people trust you enough to buy again. That’s huge. Because repeat sales are cheaper than paid ads.

Returning customer rate helps you understand:

  • Brand trust
  • Product satisfaction
  • customer experience

If this number stays low, you may need:

  • Better customer support
  • Faster delivery
  • Email marketing
  • Loyalty offers
  • Better product quality

What reports should you check inside your Shopify Analytics Dashboard?

This depends on your store size and how fast you’re growing. Still, most Shopify store owners don’t need to check everything. You only need the reports that help you make smarter decisions each week.

That’s why a quick weekly check works best. It keeps you updated without turning analytics into stress.

Best Shopify reports to check weekly

  • Sales report
  • Conversion report
  • Traffic sources report
  • Top products report
  • Returning customers report

You don’t need to spend hours inside Shopify reports. Even 15 minutes per week is enough to spot trends, catch problems early, and improve faster.

So instead of checking your store only when sales drop, make analytics a small habit. Over time, that habit can save you a lot of money and guesswork.

What does Shopify analytics tell you about your traffic?

Traffic can come from many places. And each traffic source behaves in its own way. That’s why Shopify analytics helps a lot. It shows where your visitors come from, not just how many people visited.

Inside your Shopify Analytics Dashboard, you can see traffic sources like:

  • Google Search
  • Instagram
  • TikTok
  • Facebook Ads
  • Email campaigns
  • Direct visits (people typing your store link)

This matters because all traffic is not equal. Some visitors browse. Others come ready to buy.

For example, TikTok traffic can bring a lot of views fast. However, many people just scroll and leave. On the other hand, Google traffic often converts better because people search with intent. Email traffic also converts well because those people already know your brand.

So instead of chasing “more traffic,” focus on better traffic. When you know which source brings real buyers, you stop wasting time. And you start building growth that feels stable.

How can Shopify analytics help you fix low sales?

Low sales don’t always mean your products are bad. Sometimes your store has small problems that block people from buying.

That’s where Shopify analytics helps. It shows you where customers drop off. Then you can fix the real issue instead of guessing.

Here are the most common problems Shopify analytics helps you catch.

Problem 1: You get traffic but no sales

This means people visit your store, but nobody checks out. So the traffic is real… but the trust or offer feels weak.

Common reasons include:

  • Product pages feel boring or unclear
  • Prices feel too high for the value
  • No reviews or trust signals
  • Shipping cost shows too late
  • The offer feels confusing

Fix ideas that work:

  • Write clearer product descriptions
  • Add customer reviews and ratings
  • Show delivery time and return policy clearly
  • Add a short FAQ under each product
  • Add trust badges and secure checkout icons

Once the page feels more trustworthy, sales can improve without extra traffic.

Problem 2: People add to cart but don’t purchase

This is one of the biggest problems in ecommerce. And it happens more than most store owners expect.

According to the Baymard Institute, the average cart abandonment rate is around 70%, and many shoppers leave because checkout feels long, confusing, or too expensive.

That’s why your Shopify Analytics Dashboard matters so much.

Because if you see high add to cart but low purchases, you already know the issue sits inside the checkout stage.

Fix ideas that can boost purchases:

  • Remove extra steps in checkout
  • Reduce surprise fees if possible
  • Offer free shipping over a certain amount
  • Add trust signals near payment
  • Support more payment methods (Klarna, Apple Pay, PayPal)

Even one small checkout improvement can increase sales fast.

Problem 3: Sales happen, but profit stays low

This part hurts, because sales look good… but the money still feels stuck. So the store runs, but growth feels slow.

This often happens when:

  • Shipping costs eat your margin
  • Refunds stay high
  • Ad spend is too heavy
  • Product profit is too low

Shopify analytics helps you spot what sells. But to understand profit, you also need to track a few extra numbers like:

  • Product cost
  • Shipping cost
  • Ad cost per sale
  • Refund rate

Once profit becomes clear, scaling becomes easier. Because you stop pushing products that sell but don’t earn.

How do you build a simple Shopify Analytics Dashboard routine?

You don’t need to stare at analytics daily. That can mess with your mindset. Instead, create a simple weekly routine.

15 minute weekly Shopify analytics check

Every week, check:

  • Total sales trend
  • Top 5 products
  • Conversion rate
  • Traffic source performance
  • Returning customer rate

Then choose 1 action for next week.

For example:

  • Improve one product page
  • Test a bundle offer
  • Fix a weak checkout step
  • Improve email follow ups

This routine keeps growth steady.

Shopify analytics vs Google Analytics: do you need both?

Shopify analytics is great for store performance. However, Google Analytics gives deeper insights into user behavior, like:

  • Where people click
  • How long they stay
  • What pages they exit from
  • User journeys across pages

Shopify focuses on ecommerce performance. Google Analytics focuses on visitor behavior.

So if you want deeper tracking, using both helps. Still, if you are a beginner, Shopify’s dashboard is enough to start improving.

What are the best Shopify Analytics Dashboard apps?

Shopify already gives you a good base. But some stores want more control and cleaner visuals.

Popular dashboard tools include:

  • Shopify Reports (built in)
  • Google Looker Studio (custom dashboards)
  • Triple Whale (for ad tracking)
  • Lifetimely (for LTV and profit tracking)
  • Polar Analytics (multi  channel dashboards)

Not every store needs apps. But if you run ads and want clearer attribution, some tools help.

What mistakes do Shopify owners make with analytics?

A Shopify Analytics Dashboard helps you grow, but only if you use it correctly.

Here are mistakes to avoid.

1. Only checking sales

Sales matter, but you also need to check conversion rate and traffic.

2. Tracking numbers but not taking action

Reports mean nothing if you don’t fix anything.

3. Changing your store every day

Too many changes confuse customers and ruin testing.

4. Ignoring returning customers

Repeat sales create stable growth.

5. Not tracking product performance

Some products waste your time and block profits.

Conclusion

A Shopify Analytics Dashboard is one of the simplest tools you can use to grow your store without stress. In my opinion, it works best when you treat it like a business control panel, not a fancy report page. Once you track sales, traffic, conversion rate, and product performance, your decisions feel clearer and your store becomes easier to scale.

Want help improving your Shopify store with real data?

If your Shopify store gets traffic but sales feel inconsistent, you don’t need more guessing. You need clearer tracking, better customer flow, and small improvements that increase conversions.

At Data Analytics Stack, we help Shopify stores grow using clean strategy, better content, and smart analytics. 

Contact us today, and let’s turn your store data into real growth.

Key Takeaways

  • A Shopify Analytics Dashboard helps you understand your store’s performance without using messy spreadsheets.
  • It shows your sales, traffic sources, product performance, and customer actions in one clean view.
  • The dashboard helps you find what sells, what doesn’t, and where you lose customers.
  • Better tracking helps you improve profit without spending more on ads.
  • Even small stores benefit from analytics because it saves time and avoids expensive