Multi Channel vs Single Channel Retail — What the Data Says About Profitability

Multi channel retail can be more profitable than single channel retail when each sales channel is profitable on its own. Although multi channel customers spend around 13% more per order, additional channels also reduce contribution margins and increase operating costs. The most profitable retailers measure channel profitability individually rather than relying on total revenue. 

WHAT YOU’LL LEARN 


What Is Multi Channel Retail?

What is multi channel retail

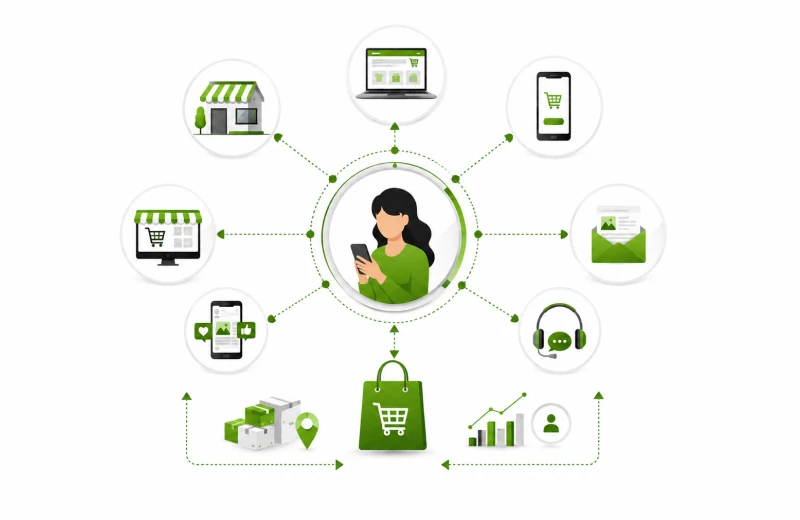
Multi channel retail means selling products through more than one sales channel, such as a Shopify store, Amazon, wholesale partners, retail stores, or marketplaces. Unlike single channel retail, businesses reach customers through multiple buying paths while managing inventory, pricing, and operations across each channel. 

Multi Channel vs Single Channel at a Glance

Multi Channel Single Channel
Higher reach Simpler operations
More customer touchpoints Higher contribution margins
Better resilience Easier inventory planning
Greater Complexity Lower operating costs
Multiple revenue sources Single source of revenue

The comparison shows why the debate between multi channel vs single channel retail is really a discussion about profitability rather than revenue. Multi channel retail increases reach and resilience, while single channel retail often delivers stronger margins and simpler operations. 

Is Multi Channel Retail More Profitable? 
Is multi channel profitable

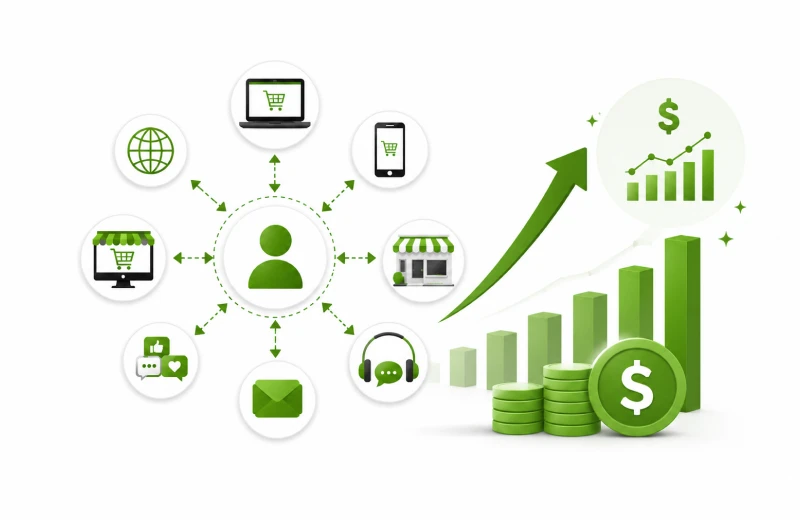
The latest profitability data shows that multi channel retail becomes more profitable only when every channel supports overall profitability rather than simply adding revenue. 

Three findings hold up consistently across recent retail research and operator data.

The omnichannel customer is genuinely more valuable 

Shoppers who engage with a brand across multiple channels show roughly a 13% AOV premium over single channel buyers, along with higher retention. Part of this is causal (more touchpoints deepen the relationship) and part is selection (your most committed customers naturally seek you out everywhere). Either way, the customers exist and they are worth more. 

Channels de risk each other 

A brand earning 100% of revenue from a Shopify store funded by Meta ads has a single point of failure: one algorithm change, one CPM spike, one account suspension. A second channel with independent demand, Amazon’s search volume, a wholesale account’s purchase orders,  is insurance that pays out precisely when the primary channel wobbles. 

Discovery compounds across channels

 Customers who first encounter a brand on Amazon or in a retail store and later buy direct are among the highest LTV cohorts many brands have, the marketplace or shelf did the acquisition work, and the DTC relationship captures the margin. Brands that track this cross-channel journey often find their ‘expensive’ channel is quietly feeding their profitable one.

Why Doesn’t Multi Channel Always Increase Profit? 

The profitability data tells a different story. While additional channels increase revenue, they often reduce contribution margins and increase operating costs. 


Channel (same SKU) Typical Contribution Margin (CM3) What Eats It
Shopify DTC 20–32% CAC / ad spend
Amazon FBA 8–20% 15% referral + FBA fees + PPC
Wholesale 8–15% 50%+ off retail price to the buyer
Own retail/pop-up Varies Rent, staff, inventory risk

Sources: Eightx – Average Ecommerce Contribution Margin: Amazon vs Shopify by Vertical, 2026 

The table shows that more sales channels do not automatically create more profit. As channels expand, contribution margins generally decrease while operating complexity increases. 

What This Margin Difference Means 

Although Amazon and wholesale channels often increase total revenue, they usually generate lower contribution margins than direct to consumer sales. Businesses should compare profit by channel rather than total sales when evaluating expansion. 

What Hidden Costs Reduce Multi-Channel Profitability? 

Most businesses estimate the additional revenue from a new sales channel but underestimate the operational costs that come with it. These hidden expenses often determine whether expansion increases profit or reduces it. 

Inventory Splitting 

Two channels means two demand forecasts, two safety stocks, and stock sitting in the wrong place at the wrong time. Brands routinely discover their stockout rate rises after channel expansion, not because demand outran supply, but because supply was split badly. The working capital requirement grows faster than revenue does.

Reconciliation and Reporting 

Each channel reports in its own format, its own attribution logic, its own fee structure. Answering ‘what was our real profit last month?’ goes from a one-source question to a data integration project. Many multi channel brands effectively fly blind on per-channel profitability for years, managing a blended number that hides one channel subsidising another.

Channel Conflict and Price Erosion 

A wholesale partner discounting your product on their site undercuts your DTC price integrity. Amazon’s algorithm punishing your listing when your own store runs a sale. Retail buyers demanding margin support. Every added channel constrains pricing freedom in the others, a cost that compounds quietly.

When Should You Expand to Multiple Sales Channels? 

The data points to four conditions. Brands meeting all four consistently profit from expansion; brands missing two or more consistently regret the timing. 

Multi Channel Readiness Checklist

Before adding another sales channel, businesses should evaluate whether they are operationally and financially ready. The following checklist summarizes the four conditions most profitable multi channel retailers share. 

The Best Time to Expand 

The most successful pattern in the 2026 data is not ‘multi channel from day one’, it is profitable single channel first, then deliberate expansion. Use the marketplace for discovery volume, wholesale for baseline cash flow, and DTC for margin and relationship, with each channel assigned a job, a margin floor, and its own P&L; line. Multi channel works as a portfolio with roles, not as a revenue scavenger hunt.

Why Blended Profitability Can Be Misleading 

The single most damaging habit in multi channel retail is managing blended profitability. A blended 18% margin can hide a 30% DTC business subsidising a −4% marketplace operation. Until each channel carries its own P&L;  with fees, allocated inventory costs, and channel specific marketing loaded,  you cannot know whether expansion helped or hurt. Many brands discover the answer years later.

Closing Thoughts

There is no universal winner in the debate between multi channel vs single channel retail. Single channel businesses often achieve higher margins with lower complexity, while multi channel retailers gain additional reach, resilience, and customer acquisition opportunities. The most profitable businesses are those that measure each sales channel independently and expand only when every new channel contributes to long term profitability. 

Key Takeaways

Know What Each Sales Channel Really Contributes

Multi channel retail is only profitable when you can measure each channel separately. DataAnalyticsStack builds multi-channel retail dashboards that track revenue, contribution margins, fees, and marketing costs by channel, so you always know which channels drive profitable growth.

Contact us today to see how better reporting can help you make smarter, more profitable retail decisions.
Why Your Meta Ads ROAS Is Lying to You (and What to Look at Instead)

Your Meta Ads ROAS is lying to you because Meta takes credit for sales it didn’t actually cause, sales that came from Google, email or customers who would have bought anyway. That’s why the number on your dashboard is usually 30-100% higher than what your store really earned. Instead of trusting it, look at blended ROAS (total store revenue ÷ total ad spend) and MER, two simple metrics that show you return, with no room for inflation.

If you’ve ever increased your Meta ad spend, watched the platform’s reported ROAS hold steady or improve, and then noticed your Shopify revenue barely moved, you’ve experienced the problem firsthand. Meta said it was working. Your bank account disagreed. 

This is not a technical glitch. It is how Meta’s attribution system is designed to work, and it systematically flatters Meta’s contribution to your revenue. Every platform does this. Meta is just the platform most DTC brands have built their growth strategies around, which makes the distortion most consequential there. 

Understanding exactly why Meta’s ROAS is overstated, and what to measure instead, is one of the highest leverage analytical changes a Shopify founder can make.

WHAT YOU’LL LEARN 

What is ROAS in Meta Ads?

What is ROAS in Meta Ads

ROAS (Return on Ad Spend) in Meta Ads shows how much revenue you earn for every dollar you spend on advertising. It helps you measure whether your Facebook and Instagram ads are making a profit.

For example, if you spend $100 on meta ads and generate $500 in sales, your ROAS is 5.0x. This means you earned $5 for very $1 spent on ads.

What is a Good ROAS for Meta Ads?

A good ROAS for Meta Ads depends on your industry, products and profit margins. In general, a ROAS between 2.5x and 4.0x for meta ads is considered good for many businesses. This means you earn $2-$4 in revenue for every $1 spent on Facebook and Instagram ads.

Businesses with high profit margins may succeed with a lower ROAS, while those with lower margins may need a higher ROAS to stay profitable.

If your campaigns consistently achieve a ROAS above your break even point, your ads are delivering positive returns. Regularly testing new audiences, improving ad creatives and optimizing landing pages can help increase your Meta Ads ROAS over time.

3 Reasons Meta ROAS Looks Better Than It Really Is 

3 Reasons Meta ROAS Looks Better

Meta ROAS looks better than it really is for three reasons: attribution window overcounting, view through attributions and the iOS tracking gap. Together, these three inflate your reported ROS well above your actual return. Let’s break each one down:

1. Attribution Window Over-Counting 

Meta’s standard attribution window is a 7-day click and a 1-day view. This means if someone clicks your ad on Monday and buys on the following Sunday, even after also seeing a Google Shopping ad, opening an email, and visiting your site directly, Meta claims credit for that sale. At the same time, Google claims it too. The same revenue gets counted in both dashboards. 

For DTC brands running Meta, Google, and email simultaneously, this overlap inflates total attributed revenue by an estimated 30–100% compared to actual Shopify revenue. Add up what Meta and Google each claim and you will typically get a number 40–60% higher than what Shopify actually recorded.

2. View Through Attribution

 Meta counts a sale as Meta-attributed if someone saw your ad (even for one second, even without clicking) and then purchased within 1 day. This is view through attribution. A customer who scrolled past your ad, forgot about it, and then Googled your brand to buy is counted as a Meta conversion. This inflates Meta’s numbers in a way that is invisible unless you run holdout tests.

3. The iOS Attribution Gap Creates Compensatory Inflation

iOS 14.5’s App Tracking Transparency reduced Meta’s ability to track conversions from iPhone users, who represent roughly 55–60% of US smartphone users. With only about 25% of iOS users opting into tracking, Meta under reports conversions. To compensate, Meta’s algorithm uses modelled conversions, statistical estimates of conversions it couldn’t directly observe. These modelled numbers are included in your reported ROAS, but they are estimates, not verified purchases.

What to Look at Instead: Blended ROAS and MER

The solution is not a better attribution tool. Attribution, figuring out which ad caused which purchase, is a genuinely hard problem, and no tool solves it completely. The solution is a better metric that doesn’t require per channel attribution at all.

Blended ROAS 

Blended ROAS is total Shopify revenue divided by total paid ad spend across all channels for the same period. No platform’s attribution model is involved. No overlap is possible. The formula is simple: if you spent $140,000 on ads this month and your Shopify store generated $490,000 in revenue, your blended ROAS is 3.5x.

MER — Marketing Efficiency Ratio 

MER goes one step further than blended ROAS. It divides total revenue by total marketing spend, including agency fees, creative production costs, and influencer payments in addition to media spend. A brand with a blended ROAS of 4.0x but $40,000 per month in agency and creative costs might have an MER of 2.8x. MER is what the P&L actually sees.

The relationship: blended ROAS is the daily operational metric. MER is the monthly P&L metric. Use blended ROAS to make fast spending decisions. Use MER to make budget planning decisions.

A Practical System for Making Spend Decisions Without Trusting Platform ROAS

To make spend decisions without trusting platform ROAS, do four things: set a blended ROAS floor, track it weekly, keep platform ROAS for within channel comparisons only and test Meta’s real impact with quarterly holdout tests. Here’s how each step works:

Set a blended ROAS floor, not a platform ROAS target 

Calculate your break even blended ROAS (1 ÷ gross margin). Set your minimum blended ROAS target above that floor by enough to cover fixed costs and generate net profit. For a brand with 55% gross margin and high fixed costs, that minimum might be 3.0–3.5x blended. 

Track blended ROAS weekly

 Every week: total Shopify revenue divided by total ad spend. Record it. If blended ROAS is stable or improving, your marketing system is healthy. If it’s declining, investigate, not by looking at platform ROAS, but by asking what changed in overall spend mix and creative performance. 

Use platform ROAS for within-channel optimization only 

Platform ROAS is useful for comparing Campaign A vs Campaign B on Meta, or keyword group X vs keyword group Y on Google. It is not useful for deciding how much to spend on Meta vs Google, because both numbers are inflated in ways that make cross-platform comparison meaningless. 

Run incremental tests quarterly 

The only real way to know how much revenue Meta drives incrementally, versus revenue you would have generated anyway, is to run a geo holdout test. Pause Meta spend in a test region for 2–3 weeks. Compare revenue change. The percentage decline in the test region gives you Meta’s true incremental contribution. This number is almost always lower than the platform ROAS suggests.

Closing Thoughts

Meta’s ROAS dashboard is not the enemy. It is useful for the job it is designed for: optimising campaigns within Meta’s ecosystem. The problem is using it as evidence that your marketing is working overall. Blended ROAS does that job, and it does it without any of the attribution inflation that makes platform reporting unreliable. 

If you are making budget decisions based on Meta’s reported ROAS alone, you are flying with an instrument that reads consistently higher than actual altitude. The blended number is what corresponds to whether the plane is going up or down.

Key Takeaways

See Your Marketing Efficiency, Not Just What Meta Reports 

DataAnalyticsStack builds Marketing Analytics dashboards that show your blended ROAS, CAC by channel, and true spend to revenue efficiency, so you can make budget decisions based on what your business actually generates, not what each platform claims.

Contact Us

What Is a Shopify Analytics Dashboard and Why Your Store Needs It

Are you running a Shopify store but still guessing what’s working and what’s not? A Shopify Analytics Dashboard shows your sales, customers, traffic, and product performance in one place, so you can make smarter decisions, fix weak spots, and grow your store with real data.

Key Highlights:

Let’s be honest for a second. Shopify is one of the easiest ways to launch an online store. You can set up products, choose a theme, and start selling fast. But after the first few days or weeks, many store owners hit the same problem.

Sales can feel random. One day you get orders. The next day, nothing happens. So you try ads. You post on Instagram. You change prices. Still, deep down, you don’t know what is really driving results.

That’s exactly why a Shopify Analytics Dashboard matters. It shows you what brings sales, what slows sales down, and what needs fixing first. So your decisions come from real numbers, not assumptions.

In this blog, I’ll explain what a Shopify Analytics Dashboard is, what it shows you, why it matters, and how it helps you make better business decisions even if you are not a “data person.”

What is a Shopify Analytics Dashboard?

A Shopify Analytics Dashboard is the reporting section inside Shopify that shows your store’s performance in a clean and simple way. It helps you understand what is happening in your store without needing spreadsheets or advanced tracking skills.

Instead of guessing why sales go up or down, Shopify shows you clear numbers like:

To make it easier, think of your Shopify store like a small shop that stays open every day. People visit your site. Some browse your products. Others scroll through pages and compare items. Many add products to the cart. Sometimes they buy. Other times, they leave.

And that’s normal.

The real problem starts when you don’t track those actions. Because if you don’t track them, you never know what’s working. You only guess.

That’s exactly where the Shopify Analytics Dashboard helps. It follows what customers do inside your store, step by step. So instead of trusting feelings, you can trust real numbers.

In the end, it helps you run your store like a real business, not like a gamble.

Why does your Shopify store need an analytics dashboard?

A lot of people start selling online with one simple mindset: “Let me add products and see what happens.” And honestly, that works in the beginning.

Still, after a few weeks, guessing stops feeling helpful. At that stage, you need direction. You need real proof. Most importantly, you need to know what to fix next.

That’s where a Shopify Analytics Dashboard becomes important. It turns your daily store activity into clear numbers, so you can make smart changes instead of random ones.

It helps you stop making blind decisions

Without analytics, most store decisions feel like guesses.

For example, you keep asking questions like:

Now imagine answering these questions with real data instead of guessing.

That’s the difference analytics makes. It gives you clarity and helps you choose based on what customers actually do, not what you think they do.

It shows what’s really making you money

This part surprises many Shopify owners. Most stores don’t earn money from every product equally. In fact, a few products often carry the whole store.

Sometimes it looks like this:

A Shopify Analytics Dashboard helps you spot your winners fast.

So instead of wasting energy on products that don’t sell, you can focus on what already works. And once you push the right product harder, growth feels easier.

It helps you fix problems before they get worse

Some store problems grow quietly. You don’t notice them right away.

For example:

At first, nothing feels “wrong.” Then one day you realize sales fell, and you don’t know why.

That’s the risky part.

But when you check your Shopify Analytics Dashboard, you can catch issues earlier. Then you can fix them before they turn into a bigger mess.

How does a Shopify Analytics Dashboard help you grow faster?

Growth doesn’t always mean adding more products or spending more on ads. Sometimes real growth comes from fixing one weak step in your store. And the dashboard helps you find that step.

For example, you might notice things like:

Once you spot the real problem, the solution becomes clearer.

That’s why the Shopify Analytics Dashboard is not just a reporting screen. It works like a growth tool, because it shows you what to improve next.

What metrics should you track inside Shopify Analytics?

Shopify shows many numbers. So it can feel confusing at first. However, you don’t need to track everything. You only need to track what helps you make decisions.

Here are the most important Shopify analytics metrics, explained in a simple way.

1. Total Sales (your store’s main scoreboard)

Total sales show how much money your store made in a set time. This matters because it shows growth or decline. But don’t stop here.

Sales alone don’t explain why things changed. So always connect it with other metrics too.

2. Orders (how many purchases happened)

Orders show how many customers bought something. This tells you a lot. It shows if sales come in consistently. It also shows if visitors turn into customers. And over time, it helps you spot if your store has real momentum.

For example: You could have high sales but low orders because one person bought a big bundle. Or you could have medium sales but high orders because many people bought small items.

Both situations need different strategies.

3. Conversion rate (the “reality check” metric)

Conversion rate shows the percentage of visitors who buy. This metric matters because it answers one main question:

Are people trusting your store enough to purchase?

If your conversion rate feels low, the problem could be:

Shopify conversion rate shows you if your store feels healthy or stuck.

4. Average Order Value (AOV)

AOV is the average amount a customer spends per order. This helps you understand profit growth. Because if your AOV rises, you can earn more without getting more traffic.

Ways to increase AOV include:

A good Shopify Analytics Dashboard helps you track if these offers work.

5. Sessions (how much traffic your store gets)

Sessions show how many visits your store received. Traffic matters because it shows demand. But traffic is not a success by itself. You could have 5,000 visitors and still make zero sales if your store feels confusing.

That’s why sessions should be tracked with conversion rate.

6. Returning customer rate (your long term growth signal)

Returning customers mean people trust you enough to buy again. That’s huge. Because repeat sales are cheaper than paid ads.

Returning customer rate helps you understand:

If this number stays low, you may need:

What reports should you check inside your Shopify Analytics Dashboard?

This depends on your store size and how fast you’re growing. Still, most Shopify store owners don’t need to check everything. You only need the reports that help you make smarter decisions each week.

That’s why a quick weekly check works best. It keeps you updated without turning analytics into stress.

Best Shopify reports to check weekly

You don’t need to spend hours inside Shopify reports. Even 15 minutes per week is enough to spot trends, catch problems early, and improve faster.

So instead of checking your store only when sales drop, make analytics a small habit. Over time, that habit can save you a lot of money and guesswork.

What does Shopify analytics tell you about your traffic?

Traffic can come from many places. And each traffic source behaves in its own way. That’s why Shopify analytics helps a lot. It shows where your visitors come from, not just how many people visited.

Inside your Shopify Analytics Dashboard, you can see traffic sources like:

This matters because all traffic is not equal. Some visitors browse. Others come ready to buy.

For example, TikTok traffic can bring a lot of views fast. However, many people just scroll and leave. On the other hand, Google traffic often converts better because people search with intent. Email traffic also converts well because those people already know your brand.

So instead of chasing “more traffic,” focus on better traffic. When you know which source brings real buyers, you stop wasting time. And you start building growth that feels stable.

How can Shopify analytics help you fix low sales?

Low sales don’t always mean your products are bad. Sometimes your store has small problems that block people from buying.

That’s where Shopify analytics helps. It shows you where customers drop off. Then you can fix the real issue instead of guessing.

Here are the most common problems Shopify analytics helps you catch.

Problem 1: You get traffic but no sales

This means people visit your store, but nobody checks out. So the traffic is real… but the trust or offer feels weak.

Common reasons include:

Fix ideas that work:

Once the page feels more trustworthy, sales can improve without extra traffic.

Problem 2: People add to cart but don’t purchase

This is one of the biggest problems in ecommerce. And it happens more than most store owners expect.

According to the Baymard Institute, the average cart abandonment rate is around 70%, and many shoppers leave because checkout feels long, confusing, or too expensive.

That’s why your Shopify Analytics Dashboard matters so much.

Because if you see high add to cart but low purchases, you already know the issue sits inside the checkout stage.

Fix ideas that can boost purchases:

Even one small checkout improvement can increase sales fast.

Problem 3: Sales happen, but profit stays low

This part hurts, because sales look good… but the money still feels stuck. So the store runs, but growth feels slow.

This often happens when:

Shopify analytics helps you spot what sells. But to understand profit, you also need to track a few extra numbers like:

Once profit becomes clear, scaling becomes easier. Because you stop pushing products that sell but don’t earn.

How do you build a simple Shopify Analytics Dashboard routine?

You don’t need to stare at analytics daily. That can mess with your mindset. Instead, create a simple weekly routine.

15 minute weekly Shopify analytics check

Every week, check:

Then choose 1 action for next week.

For example:

This routine keeps growth steady.

Shopify analytics vs Google Analytics: do you need both?

Shopify analytics is great for store performance. However, Google Analytics gives deeper insights into user behavior, like:

Shopify focuses on ecommerce performance. Google Analytics focuses on visitor behavior.

So if you want deeper tracking, using both helps. Still, if you are a beginner, Shopify’s dashboard is enough to start improving.

What are the best Shopify Analytics Dashboard apps?

Shopify already gives you a good base. But some stores want more control and cleaner visuals.

Popular dashboard tools include:

Not every store needs apps. But if you run ads and want clearer attribution, some tools help.

What mistakes do Shopify owners make with analytics?

A Shopify Analytics Dashboard helps you grow, but only if you use it correctly.

Here are mistakes to avoid.

1. Only checking sales

Sales matter, but you also need to check conversion rate and traffic.

2. Tracking numbers but not taking action

Reports mean nothing if you don’t fix anything.

3. Changing your store every day

Too many changes confuse customers and ruin testing.

4. Ignoring returning customers

Repeat sales create stable growth.

5. Not tracking product performance

Some products waste your time and block profits.

Conclusion

A Shopify Analytics Dashboard is one of the simplest tools you can use to grow your store without stress. In my opinion, it works best when you treat it like a business control panel, not a fancy report page. Once you track sales, traffic, conversion rate, and product performance, your decisions feel clearer and your store becomes easier to scale.

Want help improving your Shopify store with real data?

If your Shopify store gets traffic but sales feel inconsistent, you don’t need more guessing. You need clearer tracking, better customer flow, and small improvements that increase conversions.

At Data Analytics Stack, we help Shopify stores grow using clean strategy, better content, and smart analytics. 

Contact us today, and let’s turn your store data into real growth.

Key Takeaways