Our services

Retail analytics that turns your data into real growth

Six fully managed analytics services covering every part of your retail business — from sales and customers to inventory and profit.

We connect your Shopify, marketing, and finance data into one clear analytics system — and deliver insights on a monthly subscription. No in-house analyst needed.

Retail analytics overview
Revenue
$284K
↑ 18%
Orders
3,021
↑ 12%
AOV
$94
↑ 6%
Returning
41%
↑ 3pp
Revenue trend
Sales by channel
Top products
SKU-047$44K
SKU-012$31K
SKU-098$28K
Customer cohorts
Jan cohort68% ret.
Feb cohort61% ret.
Mar cohort57% ret.
Why retail businesses need better analytics

You have the data. You just can't see it clearly.

Most growing ecommerce brands are sitting on valuable data — but lack the visibility to act on it confidently.

Disconnected data

Sales live in Shopify, marketing in ad platforms, and finances in spreadsheets. There is no single view of your business — just scattered numbers that don't add up.

Unclear performance

You cannot confidently answer: which products drive profit, which marketing channels actually work, or which customers generate long-term value for your business.

Manual reporting

Hours wasted every week pulling exports and stitching together spreadsheets — time that should be spent making decisions and growing your business, not preparing data.

Our six analytics services

Everything your retail business needs to grow with clarity

Each service is fully managed and delivered as a monthly subscription — pick what fits your needs now and expand as you grow.

Sales analytics

Track revenue trends, channel performance, order volume, and seasonal patterns to know exactly what is driving — or holding back — your growth.

RevenueAOVSales by channelGrowth %

Customer analytics

Understand lifetime value, retention, churn, and cohort behaviour — so you know who your best customers are and how to get more of them.

LTVChurn rateCohortsRepeat rate

Product analytics

Identify which products make money and which quietly destroy your margin — then optimise assortment, pricing, and bundling decisions with confidence.

Revenue by SKUReturn rateMargin %

Inventory analytics

Never run out of top sellers. Stop tying up cash in slow-moving stock. Make smarter reorder and supplier decisions backed by real inventory data.

Stockout rateTurnoverDays of supply

Marketing analytics

Know which marketing spend generates real returns — and cut waste from every underperforming channel before it quietly drains your entire budget.

ROASCACChannel attribution

Financial & profitability analytics

Stop guessing if you are actually profitable. See exactly where margin is being lost — after all discounts, returns, and refunds are properly accounted for.

Gross marginNet profitRefund impact
Client result

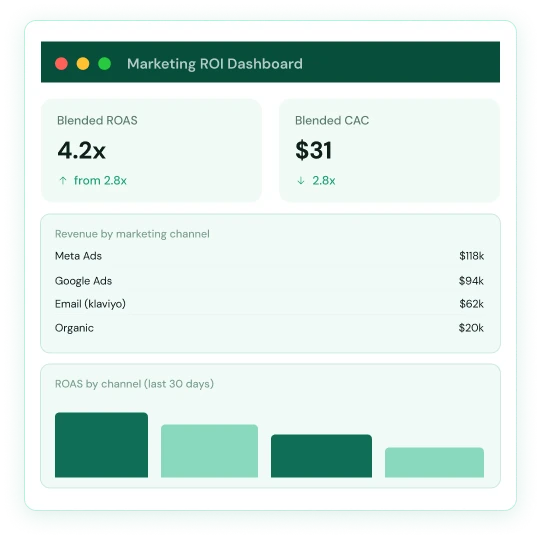
Revenue & marketing optimisation for a DTC Shopify brand

A Shopify fashion brand was struggling to understand which marketing channels were driving profitable growth. Their data was spread across Shopify, Meta Ads, Google Ads, and Klaviyo — with no unified view of performance.

We built a fully managed analytics dashboard connecting all their data sources — giving them clear visibility into revenue, customer behaviour, and true marketing ROI.

32% improvement in marketing spend efficiency within 60 days
Clear visibility into which products were actually profitable after returns
Faster, more confident decisions on campaigns and inventory planning
View full case study
Marketing ROI dashboard
Blended ROAS
4.2x
↑ from 2.8x
Blended CAC
$31
↓ 28%
Revenue by marketing channel
Meta Ads$118K
Google Ads$84K
Email (Klaviyo)$62K
Organic$20K
ROAS by channel (last 30 days)
How it works

Our BI implementation process

Five steps from data connection to live insights — fully managed by our team on your behalf.

01

Discover & define

We identify your business goals, key questions, and the KPIs that matter most to your growth decisions.

02

Data preparation

We connect your data sources, clean the data, and build structured, reliable datasets ready for analysis.

03

Build & deploy

We develop your fully managed dashboard — tailored to your business, not a generic one-size-fits-all template.

04

Validate & refine

We review every metric with you and refine until the dashboard answers your real business questions accurately.

05

Monitor & scale

Ongoing maintenance, monthly insights reports, and continuous improvements — all included in your subscription.

Common questions

Frequently asked questions

How long does it take to get started?

Most clients have their dashboard live within 2–4 weeks of onboarding, depending on the number of data sources and complexity involved.

What platforms can you connect to?

We connect to Shopify, Meta Ads, Google Ads, Klaviyo, Google Analytics, and most platforms retail brands use. If you use it, we can likely connect it.

Do I need any technical knowledge?

None at all. We handle everything — data connections, modelling, dashboard setup, and ongoing maintenance. You just log in and use it.

Can I get more than one service?

Yes. Most clients start with one or two services and expand over time. Our Growth and Advanced plans cover multiple services in a single subscription.

Is everything customised for my business?

Yes. Every dashboard is built around your specific KPIs, channels, and business questions — not a one-size-fits-all template.

What do I actually receive each month?

A live dashboard with view access, plus a monthly insights report with plain-English commentary on your key metrics and recommended actions.

Ready to see what your data has been hiding?

Book a free 30-minute strategy call. We will review your current setup and show you exactly where your biggest growth opportunity is.