
Economics Analytics
Why Most Shopify Stores Lose Money on First Time Buyers
Many Shopify founders assume every sale makes money. In reality, the first order often recovers
7 MIN READ
Read
Data Analytics Stack turns data into insights to help you make better business decisions. We connect your Meta Ads, Amazon, GA4, Shopify, QuickBooks, Klaviyo, and other data sources to run and manage data analysis. You get consistent retail analytics with practical insights without an in-house analyst for enhanced business decisions that aid in growth and scalability.
The Problem
A data dashboard only shows current stats and doesn't explain how and why, or the next steps. We connect raw retail data, run analysis, and turn e-commerce metrics into practical answers to help you understand your profit margins, inventory, customer behaviour, and channel performance.
Understand Why Profit Keeps Disappearing
We connect sales, advertising, and product data to help you learn where you are making the most revenue and where you are losing money.
Do More Than Just Acquire Customers
We identify areas for improvement to enhance customer lifetime value, repeat purchases, and long-term retention.
Understand When and How Much to Stock
We analyse patterns of product movement to help you understand what to stock and how much for better sales.
We Combine Channel Data to Find Actionable Insights
We bring Shopify, Amazon, and other channel data together to understand customer behaviour and marketing performance.
Human-AI Analytics Nexus
With our AI Data Analytics services, you can understand your customer better, optimize inventory management, improve sales with AI-driven forecasts, and increase ROI. We combine AI and Data analytics to help retail stores use artificial intelligence in business to find actionable insights and new opportunities for growth.
INPUT — YOUR STACK
PROCESS — THE NEXUS
OUTPUT — WHAT YOU GET
How It Works
No Technical Setup on your end. We handle everything
Book a free strategy callShopify, Meta, Google, Klaviyo, Amazon & more — securely, read-only, no migration.





Clean data , KPIs in plain business language, dashboards that match how you operate.
Live dashboards + insight reports + partner who tells you what yo do next.
OUR SERVICES
You don't need to invest in expensive software or build an analytics team to understand retail data. Data Analytics Stack does all the heavy lifting to track and manage analytics across scales, customers, inventory, products, marketing, and accounting to give you a clear and actionable roadmap for the next profitable decision.
Revenue Clarity Across Every Channel
Understand how sales are changing across different channels and how each channel helps with profitability.
Explore Sales AnalyticsKnow Which Customers Are Worth Keeping
Learn customer behaviour and analyse repeat purchases, retention, customer lifetime value, and customer segments.
Explore Customer AnalyticsFind the Products that Drive Growth
Revenue alone does not indicate which products are profitable. With product margin analytics, find out the strongest products.
Explore Product AnalyticsLearn What to Restock and How Often
Track inventory turnover, stock levels, excess inventory, potential shortages, and product movement for better inventory decisions.
Explore Inventory AnalyticsUnderstand Ad Spend and its Connection to Results
Measure marketing performance by combining data from sales, customers, and revenue to identify and fix gaps.
Explore Marketing AnalyticsSee Where You Are Making the Most Money
We combine data from revenue, expenses, marketing costs and other driving factors to understand the profitability factors.
Explore Financial AnalyticsAnswer 8–10 quick questions about your revenue, margins, and customer data. No email required to see your result — just a straight answer on where your analytics stand today.
Take the 2-Minute ScorecardWHO WE SERVE
If you are running a Shopify brand, you need practical answers from different channels including social media channels such as TikTok and wholesale channels. Our analytical solutions help you get analytical data
01
Shopify and DTC brands need more than daily revenue. We help you extract analytics from customer, marketing, and financial data to help map the user journey for predictable results.
CUSTOMER JOURNEY BY STAGE
02
We bring different channels (including Shopify, Amazon, and retail) together to understand total revenue, marketing results, customer behaviour, and profitability.
CONTRIBUTION BY CHANNEL
03
We organise wholesale data to measure orders, margins, and distribution performance to help understand product performance.
REVENUE SHARE BY ACCOUNT
04
We connect TikTok Shop data with metrics like costs, customer data, and product performance to help sellers understand real revenue.
GROSS SALES VS. REVENUE AFTER RETURNS
Client Results
Real results from founders, operators and retail teams who turned complex data into confident business decisions.

We had so much information that we could not make sense of, but thanks to Data Analytics Stack, we connected our Shopify store with multiple channels to identify profit margins and the gaps where we were losing money. Within three months, we were able to increase our profit by 10X within a few months.

Our Shopify store was generating revenue but we were still losing profit. Data Analytics Stack, helped us measure channel performance to find gaps that were making us lose profit. We learned the exact channel performance and took decisions that improved our scalability.

We knew our wholesale business was growing, but we didn't know exactly where the revenue was coming from. Data Analytics Stack helped us understand our customers and products that were bringing us the most profit to restock products that are in most demand.
Built on the platforms your data already runs on.





FAQ
Everything you need to know before getting started.
2–3 weeks for most clients. We handle connections, cleaning, and setup you just grant access.
Meta Ads, Amazon, GA4, Shopify, QuickBooks, Klaviyo, TikTok Shop and other retail data sources. If you use something else, we will confirm it on the strategy call.
No. There is no technical setup on your end and no in-house analyst needed — we run and manage the analysis and deliver the insights.
We connect read-only to your existing tools. Nothing is migrated out of your systems and access stays under your control.
Yes. Dashboards, KPIs and reports are adjusted as you add channels, products and markets, so the reporting keeps matching how you operate.
Resources
No technical jargon. No developer speak. Just clear, actionable insights on retail analytics, KPIs, and growth — written for founders and operators.
Economics Analytics
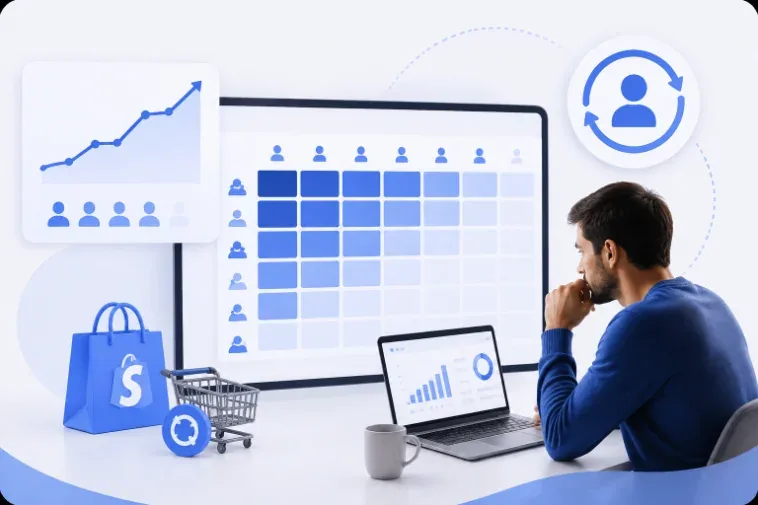
Many Shopify founders assume every sale makes money. In reality, the first order often recovers
Ecommerce Analytics
A good gross profit margin for eCommerce is 50%–70%. This range gives businesses enough room to cover operating costs and invest in growth, while margins above 70% are considered excellent.
Inventory Analytics
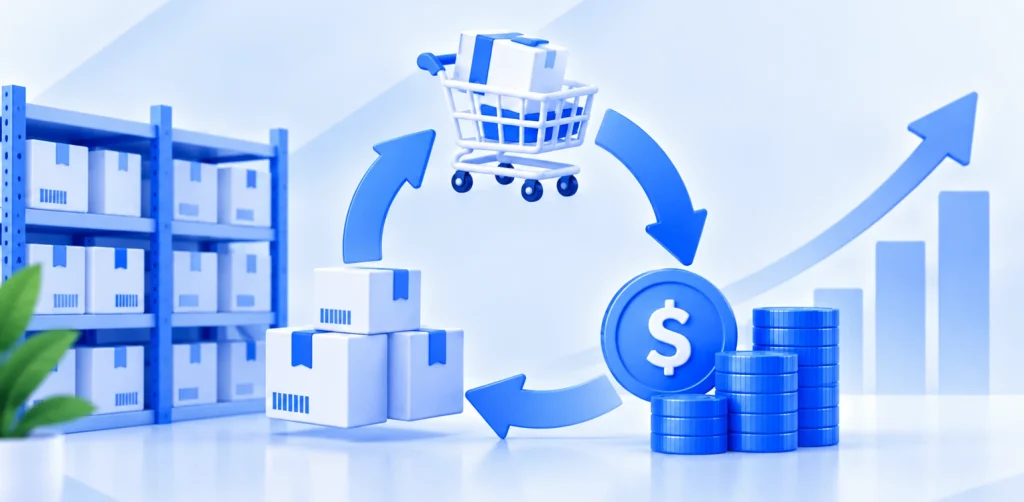
Inventory turnover is more than an inventory metric. It shows how quickly your business turns stock into sales and cash.
Work with a specialist retail analytics partner to uncover revenue drivers, customer behaviour patterns, and growth opportunities hidden in your data.