How to Calculate Your True Customer Acquisition Cost on Shopify
Customer acquisition cost (CAC) is calculated by dividing your total sales and marketing expenses by the number of new customers acquired during the same period. This calculation shows how much it costs your business to gain one new customer and helps you measure the efficiency of your marketing efforts.
It is the single most important number in your growth model. It determines how aggressively you can scale, which channels are worth investing in, and whether your growth is building value or consuming it. Most Shopify founders know their CAC as a rough number. Very few have actually calculated it correctly.
The typical mistake is dividing ad spend on one channel by the new customers acquired from that channel. That gives you a channel CAC that misses 30–50% of the real cost. A more honest calculation includes every dollar spent to acquire a customer, including creative production, agency fees, tools, and marketing software, divided by every new customer acquired across all channels.
In 2026, e-commerce CAC has risen 60% over five years. The average blended CAC for Shopify stores sits between $68–$84, with significant variation by vertical. Understanding your real number is the foundation for every growth decision that follows.
WHAT YOU’LL LEARN
- What is customer acquisition cost?
- How to calculate customer acquisition cost?
- Why are most CAC calculations wrong?
- The complete CAC formula, including costs most brands miss
- 2026 CAC Benchmarks by E-commerce Vertical
- Blended CAC vs channel-specific CAC and when to use each
What is Customer Acquisition Cost?
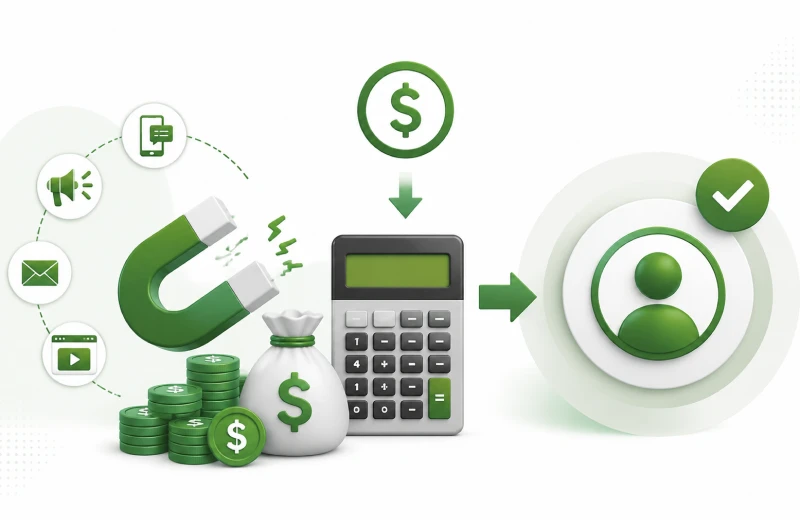
Customer acquisition cost (CAC) is the total amount you spend to win one new customer, ad spend, agency fees, discounts, software costs and influencers’ fees, divided by the number of new customers you gained in that period. Spend $10,000 and get 200 new customers and your CAC is $50.
CAC is important because it shows whether your growth is actually profitable. If a customer costs $50 to acquire but only spends $40, you’re losing money on every scale. As long as customers are worth more than they cost to get, your marketing is healthy.
How to Calculate Customer Acquisition Cost?
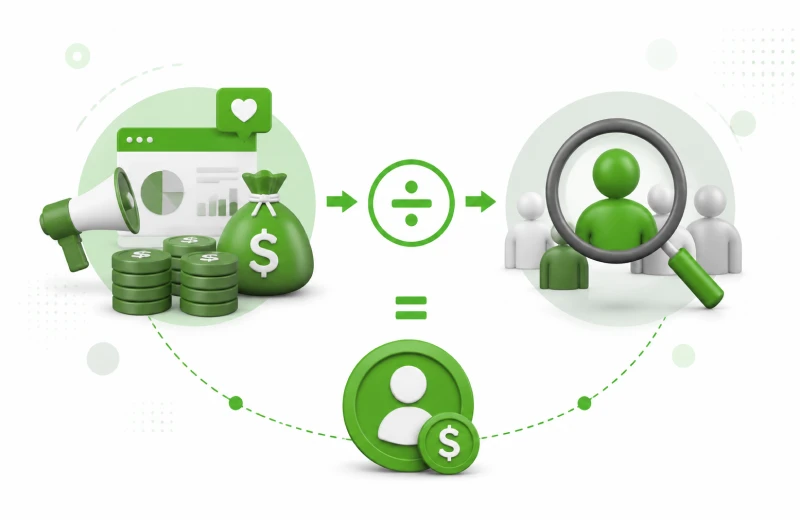
You can calculate Customer Acquisition Cost (CAC) on Shopify by using a simple formula:
Customer Acquisition Cost Formula
Customer Acquisition Cost = Total Sales and Marketing Costs ÷ Number of New Customers
It is one of the most important marketing metrics because it shows how efficiently your sales and marketing efforts turn prospects into paying customers.
Review your CAC regularly to understand how well your marketing budget is performing. A lower CAC means your customer acquisition strategy is more efficient, especially when customers generate more revenue than it costs to acquire them.
Why Most CAC Calculations Are Wrong?
Founders most commonly calculate CAC as: ad spend on a single platform ÷ orders from that platform.
This version is wrong in three ways.
- It only counts one channel. A customer who came from organic search costs something too, the SEO investment, the content creation time, the tools. Those costs exist even if they are harder to attribute per customer.
- It counts orders, not new customers. Returning customers converting via a remarketing ad are not acquisition; they are retention. CAC should be calculated against net new customers, not total orders.
- It excludes the full cost of acquisition. Agency fees, creative production costs, Klaviyo, analytics tools, and the time your team spends on marketing are all acquisition costs. Excluding them makes CAC look lower than it is.
2026 CAC Benchmarks by E-commerce Vertical
CAC varies enormously by product category, primarily because of differences in average order value, purchase frequency, and how competitive each category is on paid channels.
Blended CAC vs Channel-Specific CAC: When to Use Each
These are two different tools that answer different questions. Using them interchangeably leads to bad decisions.
Blended CAC
Total marketing spend ÷ total new customers. This is your headline number, the one that drives business level decisions. If your blended CAC is $95 and your LTV is $240, your unit economics are workable. If blended CAC is $95 and LTV is $110, you have a structural problem to solve before you scale.
Channel Specific CAC
Spend on one channel ÷ new customers acquired from that channel. This tells you which channels are efficient and which are burning budget. A blended CAC of $85 can hide a Meta CAC of $140 and a Google CAC of $55, the blend looks fine, but one channel is destroying value while another subsidises it. You need channel-level visibility to find those leaks.
4 Metrics to Use With CAC
Here are the 4 metrics to use with customer acquisition cost:
- Return on ad spend (ROAS)
- Gross margin
- Sales efficiency
1. LTV (Customer Lifetime Value)
LTV measures the total revenue or profit a customer generates throughout their relationship with your business. Comparing LTV with CAC helps you understand long term profitability. A healthy LTV:CAC ratio is around 3:1, meaning customers generate three times more value than they cost to acquire.
2. Return on Ad Spend (ROAS)
ROAS measures how much revenue you earn for every dollar spent on advertising. It helps you evaluate whether your ad campaign is generating enough sales to justify your CAC. Higher ROAS usually means more efficient marketing.
3. Gross Margin
Gross margin shows the percentage of revenue left after subtracting the direct cost of producing or delivering your products. A strong gross margin gives you more room to spend on customer acquisition while remaining profitable.
4. Sales Efficiency
Sales efficiency measures how effectively your sales and marketing efforts turn spending into new revenue. It helps you understand whether your customer acquisition strategy is delivering sustainable growth and where improvements are needed.
3 Common Causes of High Customer Acquisition Costs
High CAC usually comes down to 3 culprits: cart abandonment silently inflating your effective Cost per customer, creative fatigue pushing your cost per click up week after week and seasonal buyer making your blended CAC look better than it really is.
Here is how each one works and how to fix it:
Cart abandonment is inflating your effective CAC
The Baymard Institute puts average e-commerce cart abandonment at 70%. If 1,000 people add to the cart and 701 don’t buy, your ad spend acquired all 1,000 visitors, but only 299 converted. Your CAC is calculated against the 299, which means each of those 701 abandonments raises your effective acquisition cost.
A cart recovery email and SMS sequence that recovers just 15% of abandonments gives you 15% more customers from the same ad budget with zero additional spend.
Creative fatigue is raising your cost per click without showing up in CAC
Meta ads typically show declining performance after 14–21 days of continuous serving. When click-through rates drop, cost-per-click rises, and CAC rises with it, but gradually enough that it is easy to attribute it to other causes. Auditing creative performance dates and refreshing any ad set running on creatives older than 30 days often reveals significant CAC efficiency gains.
You are acquiring seasonal customers and counting them as real CAC
Gifting categories (candles, homeware, food gifts) typically acquire a surge of customers in Q4 at low CAC because purchase intent is naturally high. Blended annual CAC looks excellent. But 80–85% of those customers never return post-holiday. The real CAC for acquiring a recurring customer is often 3–5x the blended annual figure. Seasonal acquisition and recurring acquisition need to be calculated separately.
Closing Thoughts
Customer acquisition cost is not a single number; it is a system of numbers that tells different stories at different levels of granularity. Your blended CAC tells you whether your growth model is financially sustainable. Your channel specific CAC tells you where to reallocate budget.
Your cohort CAC tells you whether the customers you are acquiring are the kind that generate long-term value. Most Shopify founders only have the first number, and even that one is usually undercounted. Getting all three in view is one of the most impactful analytical steps a growing brand can take.
Key Takeaways
- True CAC includes all marketing spend, media, agency fees, creative production, and marketing tools, not just ad spend.
- Calculate CAC against net new customers only, not total orders (returning customers are retention, not acquisition).
- Average blended CAC for Shopify stores in 2026 is $68–$84, up 60% over five years.
- Blended CAC drives business decisions; channel-specific CAC reveals where money is leaking.
- A healthy LTV:CAC ratio is 3:1 minimum; below 2:1 signals broken unit economics.
- Cart abandonment recovery is often the fastest way to lower effective CAC without touching ad spend.
- Creative fatigue after 14–21 days is one of the most common and most overlooked causes of CAC inflation.
- Seasonal customers need their own CAC calculation, as they dramatically reduce blended CAC while rarely returning post season.
- Email marketing has the lowest CAC of any channel at $8–$15 per customer; growing your list reduces blended CAC over time.
Know Your True Acquisition Cost, Across Every Channel
DataAnalyticsStack builds Marketing Analytics dashboards that calculate your true blended CAC, show channel level efficiency, and compare your LTV:CAC ratio in one place, so acquisition decisions are based on real numbers, not estimates.