Every growing Shopify store faces the same challenge. Order too little and you lose sales. Order too much and cash gets tied up in products that sit on the shelf. Finding the right balance is one of the hardest parts of running an ecommerce business.
According to IHL Group, poor inventory management costs retailers $1.7 trillion every year through lost sales, excess stock, and unnecessary storage costs. For many Shopify businesses generating $500,000 to $2 million in annual revenue, preventable overstock alone can lock up $30,000–$150,000 in working capital. That is money that could otherwise support marketing, new products, or business growth.
The good news is that you do not need complicated forecasting models to improve your inventory decisions. With the right data and a few simple calculations, you can reduce stockouts, avoid over ordering, and keep more cash available for your business.
Better inventory decisions do more than reduce stock problems. They improve cash flow, increase customer satisfaction, and give your business more flexibility to grow.
It starts with understanding why inventory problems happen in the first place.
WHAT YOU’LL LEARN
- Why stockouts and overstock are both symptoms of the same problem
- The four data signals that predict a stockout before it happens
- How to calculate reorder points and safety stock without complex modelling
- The inventory decision that frees up the most cash the fastest
Why Stockouts and Overstock Keep Happening
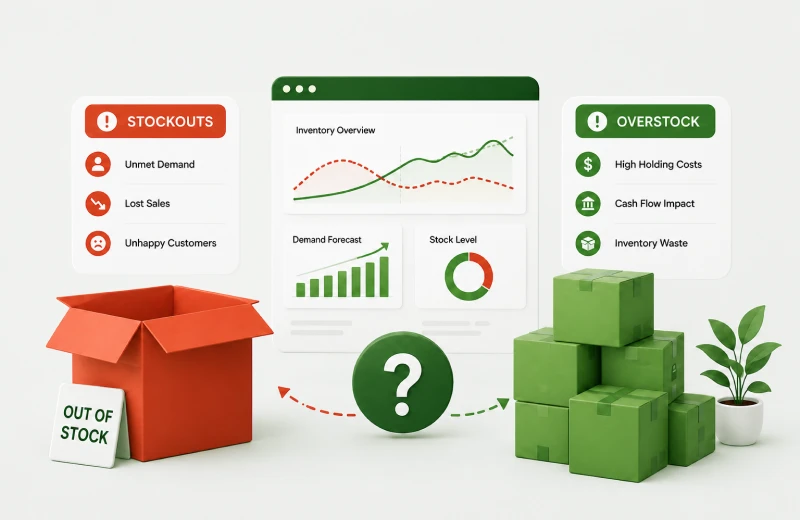
Stockouts and overstock rarely happen by accident. In most cases, they come from a few common mistakes in the way inventory is planned and managed.
Forecasting on revenue instead of units
Many stores plan inventory based on sales revenue instead of units sold. That creates problems because revenue changes when prices change. Inventory planning works best when you forecast the number of products customers actually buy.
Using the same reorder point for every SKU
A fast moving product with a 3-day supplier lead time needs a very different safety stock than a slow mover with a 45-day lead time. Applying the same reorder logic across your catalogue guarantees you will be overstocked on slow movers and understocked on fast ones.
Not accounting for demand variability
Customer demand changes from week to week. Sales often increase during promotions, holidays, or seasonal events. A product averaging 15 units per day might range from 8 to 40 depending on day of week, promotions, and seasonality. Safety stock needs to account for that range, not just the mean.
Treating all stockouts the same
Not every stockout has the same impact. Running out of your best selling product can cost thousands in lost sales, while running out of a slow moving item may have very little effect. Focus your inventory investment where it matters most.
How to Calculate Your Reorder Point
A reorder point tells you exactly when to place your next order. Instead of guessing, you use your sales data and supplier lead time to calculate the right moment.
REORDER POINT FORMULA
Reorder Point = (Average Daily Sales × Lead Time in Days) + Safety Stock
Safety Stock = 1.65 × Standard Deviation of Daily Sales × √(Lead Time)
(1.65 = z-score for 95% service level, i.e. 95% chance of no stockout)
Example:
- Average daily sales: 18 units
- Lead time: 21 days
- Std deviation of daily sales: 6 units
- Safety stock = 1.65 × 6 × √21 = 1.65 × 6 × 4.58 = 45 units
- Reorder point = (18 × 21) + 45 = 378 + 45 = 423 units
- When inventory hits 423 units, place your next order.
This simple calculation helps you place orders before stock runs low instead of reacting after you’ve already lost sales.
Don’t worry if the formula looks technical. Most inventory software or even a simple spreadsheet can calculate it automatically once you enter your sales data.
How to Spot a Stockout Early

Stockouts usually leave warning signs before they happen. Watching these signals helps you react early and avoid lost sales.
Daily sell through rate acceleration
A sudden increase in sales is often the first warning that demand has changed. For example, if a product normally sells 12 units a day but suddenly starts selling 22, your existing reorder point may no longer be enough. That increase is often an early warning that demand has changed.
Days of stock remaining declining faster than usual
A simple way to measure this is:
- Current stock ÷ Average daily sales = Days of stock remaining
If this number drops below your lead time plus safety buffer, you are at stockout risk. Review this weekly for your top 20 SKUs by revenue.
Promotional calendar alignment
Promotions, influencer campaigns, holidays, and seasonal events can increase sales much faster than normal. Planning inventory before these events helps you avoid unexpected stockouts.
Supplier lead time extensions
If your supplier extends their lead time from 21 days to 35 days, even temporarily, your existing reorder points are wrong. Maintain a lead time log per supplier and update reorder calculations whenever lead times change.
ABC Inventory Analysis
Not every product deserves the same amount of inventory. ABC analysis helps you identify which products generate the most revenue and which ones quietly tie up your cash.
| Category | % of Revenue | % of SKUs | Inventory Priority |
| A — Core performers | 70–80% | 10–20% | Never run out. Heavy safety stock. |
| B — Secondary movers | 15–20% | 20–30% | Maintain standard reorder logic. |
| C — Slow movers | 5–10% | 50–70% | Reduce safety stock. Review quarterly. |
C category products sitting in your warehouse for more than 90 days with no meaningful sales velocity should be reviewed for markdown, bundle inclusion, or discontinuation. The cash tied up in C category overstock is almost always worth more deployed into A category safety stock or marketing spend.
THE OVERSTOCK CASH TRAP
A Shopify brand doing $800k/year carries an average of $120k in inventory at any given time. If 40% of that is C category stock turning fewer than twice per year, $48k in working capital is effectively frozen. That is marketing budget that cannot be spent, stock that cannot be discounted without margin damage, and warehouse space that is not generating returns.
Inventory Metrics Every Shopify Store Should Track
Numbers tell the real story behind your inventory. If you skip these metrics, you run your store on guesswork. Track them instead, and you spot problems before they cost you sales.
Here are the metrics that matter most:
-
Inventory turnover
This shows how many times you sell and replace your stock in a set period. A higher number means your products move fast.
-
Sell through rate
This tells you what percent of your stock you sell within a certain time. It helps you spot slow movers early.
-
Days of inventory
This shows how many days your current stock will last at your normal sales pace. Low numbers warn you to reorder soon.
-
Stockout rate
This tracks how often you run out of a product. A high rate means lost sales and frustrated customers.
-
Gross margin return on inventory (GMROI)
This shows how much profit you earn for every dollar you spend on inventory. It tells you which products actually pay off.
Track these five metrics, and you get a clear picture of your store’s health. You’ll know what to restock, what to discount, and what to drop altogether.
Closing Thoughts
Small improvements made consistently often have a much bigger impact than trying to predict every change in demand. You want enough stock to meet customer demand without filling your warehouse with products that do not sell. By reviewing sales data regularly, updating reorder points, and tracking slow moving products, you can reduce stockouts, improve cash flow, and make smarter purchasing decisions as your business grows.
Key Takeaways
- Stockouts and overstock usually come from poor inventory planning rather than bad luck.
- Reorder points should be calculated per SKU based on actual daily velocity, lead time, and demand variability, not applied uniformly
- Safety stock formula: 1.65 × standard deviation of daily sales × √lead time (for 95% service level)
- Track 7-day vs 30-day sell through rate weekly by SKU, acceleration is your earliest stockout warning
- Days of stock remaining (current stock ÷ 14-day average daily sales) should be reviewed weekly for top SKUs
- Promotional calendar planning 6–8 weeks ahead prevents the most common seasonal stockout
- ABC analysis reveals which SKUs are holding most of your warehouse cash, C category overstock is the fastest working capital release
- Updating reorder points whenever supplier lead times change is one of the most commonly skipped, and most expensive, inventory management tasks
Need Better Inventory Insights?
See which products are slowing down your inventory turnover, tying up cash, and reducing profitability. DataAnalyticsStack helps Shopify brands track inventory turnover, days on hand, sell through rates, and SKU performance in one easy dashboard.
Contact us today to see how better inventory insights can improve your cash flow.