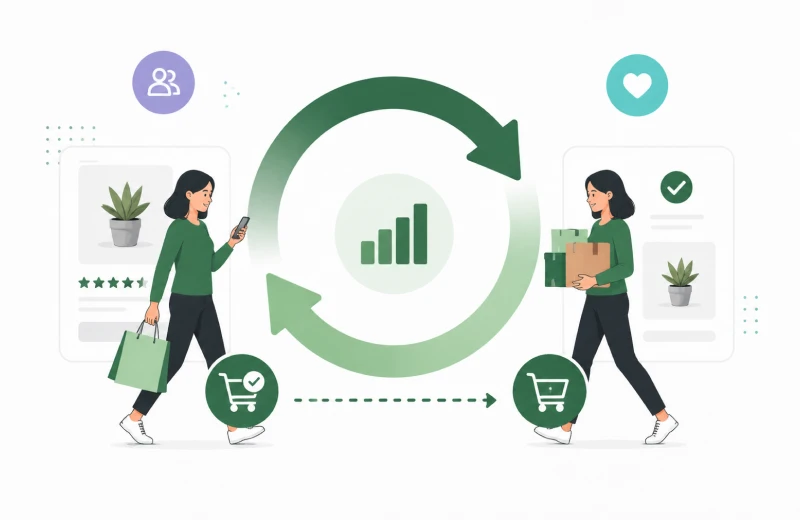
Repeat purchase rate is the metric that tells you whether your store is building real customer loyalty or simply relying on paid ads to drive sales. Improve it by just 5 percentage points and, according to research from Bain & Company, profits can increase by 25–95%. The number may seem surprising, but the research supports it.
Most Shopify stores lose 70–75% of their customers every year. That means for every four customers you acquire in January, three may never buy from you again. If your marketing budget focuses only on acquiring new customers without a strategy to bring them back, growth becomes more expensive and harder to sustain.
This guide explains what a good repeat purchase rate looks like in 2026, why category benchmarks matter more than overall averages, and which retention strategies have the biggest impact.
WHAT YOU’LL LEARN

Repeat purchase rate (also called repeat customer rate or returning customer rate) is the percentage of your customers who have made more than one purchase within a given time period, usually 12 months.
Repeat purchase rate measures actual repurchasing behavior.
The average ecommerce repeat purchase rate is 28.2% (Shopify, 2025) but that number is almost meaningless without category context. A 20% repeat rate might be excellent for luxury goods and poor for supplements.
28.2%
avg Shopify repeat rate
25–95%
profit increase from 5% retention gain
5–25x
cost to acquire vs. retain a customer
| Category | Avg Rate | Strong Rate | Context |
| Supplements & Health | 33–36% | 40–50% | Replenishment drives frequency |
| Beauty & Skincare | 30–35% | 38–45% | Routine based; loyalty friendly |
| Food & Beverage | 28–32% | 38–50% | High frequency; subscription potential |
| Apparel & Fashion | 20–26% | 30–38% | Lower frequency expected |
| Home Goods | 15–22% | 25–30% | Seasonal; style driven churn |
| Luxury / High ticket | 10–18% | 22–28% | Longer purchase cycles |
| All Shopify average | 27–28% | 30–40% | Target 30%+ for strong performance |
Sources: Shopify Enterprise; Rivo 2026 Benchmark Report; Finsi Retention Intelligence; Mobiloud 2026
Benchmark figures may vary by industry, customer lifecycle, and reporting methodology. Always compare your performance against businesses in the same category.
A repeat rate below 20% usually means one of three things: your product is disappointing customers after purchase, your post purchase experience is non-existent, or your pricing structure is attracting deal hunters who were never going to return. Fix this before scaling ad spend.
Most Shopify brands sit here. It means your product is solid and some customers are coming back, but you’re not capturing the full retention opportunity. Small improvements in post purchase communication and loyalty will move you out of this range.
Your retention efforts are working. The focus now shifts to increasing purchase frequency among repeat buyers and growing their average order value, rather than acquiring more new customers to compensate for churn.
Typically seen in subscription models and high frequency consumables. At this level, invest aggressively in loyalty, referrals, and wallet share. Your existing customer base is a genuine growth asset.

Loyal customers make up just 21% of a typical Shopify brand’s customer base, but they generate 44% of total revenue and 46% of total orders. A repeat customer has already validated your product, trusts your brand, and requires zero acquisition cost to sell to again. The conversion probability for an existing customer is 60–70%. For a new prospect, it’s 5–20%. That 12x differential is why brands that solve retention build durable businesses while brands that rely entirely on new acquisition are permanently fragile.
If you spend $40 to acquire a customer who spends $60 on their first order and your COGS is $25, you barely break even. The second purchase, at zero acquisition cost is where the margin lives. Brands that don’t generate a second purchase within 90 days from a meaningful share of first time buyers are essentially running at a structural loss.
Modern ecommerce brands use customer analytics and AI tools to identify which customers are most likely to buy again. By analysing purchase history, product preferences, and engagement behavior, businesses can send more relevant offers and recommendations.
AI can also help predict customer churn before it happens. This allows brands to reengage customers with personalised campaigns, loyalty rewards, or replenishment reminders before they stop buying altogether.
As competition increases, retention strategies powered by customer data often deliver a higher return than acquiring more first time customers.
If you don’t have an automated email sequence running in the 7–90 days after a first purchase, this is the single highest leverage starting point. A well structured flow, order confirmation, delivery follow up, educational content, and a repurchase nudge, can lift the second purchase rate by 15–25%.
For consumable products, time your re engagement emails to arrive just before the product runs out. A supplement brand sending a replenishment reminder on day 25 of a 30 day supply converts at dramatically higher rates than a generic monthly newsletter.
Loyalty programme members show 28% higher retention rates and 18% higher AOV. It doesn’t need to be complex, even a simple points for purchases structure gives customers a reason to return to you rather than a competitor.
Use RFM analysis (Recency, Frequency, Monetary value) to identify your top 20% of customers. Send them early access, exclusive offers, or personalised outreach. VIP customers generate 73% higher AOV and 3.6x more purchases than standard customers.
45% of customers switch brands due to poor customer service. Fast shipping, easy returns, and responsive support are the baseline for repeat purchase. If your delivery experience or returns process is creating friction, address that before spending on retention marketing.
Repeat purchase rate is the clearest indicator of whether your Shopify store is building a real business or just running an acquisition machine.
The economics are unambiguous: repeat buyers cost nothing to acquire, convert at dramatically higher rates, and spend more per order. A 27% repeat rate means 73% of your customers are leaving and not coming back. That is the retention gap, and closing even a fraction of it will do more for your profitability than any new customer acquisition tactic.
Improving repeat purchase rate starts with understanding customers. Which products drive repeat orders? Which channels bring returning buyers? Which segments create the highest lifetime value?
DataAnalyticsStack helps ecommerce brands track repeat purchase rate, customer lifetime value, cohort performance, and retention trends through custom analytics dashboards built for growth.
Contact us today to get started.
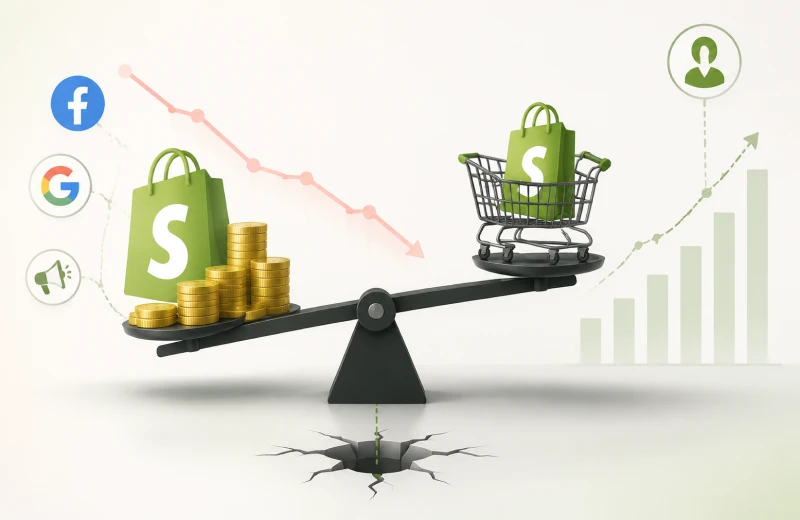
Many Shopify founders assume every sale makes money. In reality, the first order often recovers only part of the cost of acquiring a new customer. Rising advertising costs have made this an even bigger challenge. For many ecommerce brands, the first purchase breaks even at best or loses money altogether.
That does not mean your business is failing. It means long term profitability depends on what happens after the first purchase. If customers come back, your acquisition cost gets spread across multiple orders. If they never return, your business has to keep paying to replace them.
This guide explains why first order profitability is so difficult to achieve, how to measure whether your customer acquisition costs are sustainable, and what turns a first time buyer into a profitable long term customer.
WHAT YOU’LL LEARN

CAC payback period is the number of months it takes for the revenue (or margin) from a customer to recover the cost of acquiring them. For DTC brands with high acquisition costs, this payback period is often 6–12 months, which means most brands are cash flow negative on a new customer for the better part of a year before that customer relationship starts generating profit.
If your payback period is longer than six months, strong customer retention becomes essential. Otherwise, many customers leave before you recover your acquisition costs.
Here is the unit economics of a typical $80 first order for a DTC apparel brand, including customer acquisition cost:
| Line Item | Amount | Notes |
| Gross Revenue | $80.00 | Selling price |
| Less: Returns (est.) | −$12.00 | 15% return rate allocation |
| Net Revenue | $68.00 | |
| Less: COGS | −$24.00 | 30% of gross revenue |
| Less: Shipping | −$8.00 | Outbound fulfilment |
| Less: Payment fees | −$2.40 | ~3% processing |
| Contribution Margin | $33.60 | 42% before marketing |
| Less: CAC (allocated) | −$40.00 | Blended ad spend per new customer |
| First Order Net | −$6.40 | LOSS on first transaction |
At first glance, the order looks profitable because the contribution margin is 42%. Once customer acquisition cost is included, however, the first order generates a $6.40 loss. The business only becomes profitable when that customer places a second order without another acquisition cost.
These numbers explain why first order profitability has become such a challenge for many DTC brands. Research from SimplicityDX found that brands lose $29 on average for every new customer acquired, while customer acquisition costs have increased by 222% over the past decade. Industry benchmarks also place median customer acquisition costs at roughly $130–156 per customer for many U.S. ecommerce brands.

The 90 day window after the first purchase is the most critical period in a customer relationship. Customers who buy again within 90 days have much higher lifetime value (LTV) and repeat purchase rates. Those who don’t buy within 90 days are far less likely to ever return. Your post purchase email sequence must give this period special attention.
45% of customers who switch brands do so because of poor customer service. A slow delivery, a confusing returns process, or no communication after the order confirmation is enough to kill a relationship that cost you $140 to start. The post purchase experience is more than shipping and fulfillment. It is a critical marketing touchpoint.
The question is not whether you lose money on a first order, most brands do. The question is whether your LTV is high enough to make the total customer relationship profitable. An LTV:CAC ratio of 3:1 is the typical minimum target. If your LTV is $150 and your CAC is $140, your economics are financially unsustainable regardless of how good your margins look on any individual order.
THE CRITICAL INSIGHT
First order loss is not a failure, it is the model. The failure is not having a retention system that recovers the investment. A brand that loses $6 on every first order but achieves a 35% repeat purchase rate and $320 LTV is an excellent business. A brand that loses $6 on every first order and has a 15% repeat rate is running out of runway.
First order profitability is almost a red herring. The real question is whether your total customer economics work. A first order that loses $6 and generates a customer worth $300 over 3 years is a great investment. The brands that understand this build retention systems that systematically recover acquisition costs through second and third orders. The brands that don’t understand this keep raising ad budgets and wondering why the bank account doesn’t grow with revenue.
Most Shopify dashboards show you revenue per order, not profit per customer relationship. The insight that changes decisions is whether your LTV:CAC ratio works and whether your retention system is recovering your acquisition costs. DataAnalyticsStack builds Customer Analytics dashboards that track LTV, CAC, payback period, and retention, so you always know whether your customer economics are sustainable before you scale.
Contact us today to build a dashboard that shows your true customer profitability.
Revenue and profit are two of the most important numbers in ecommerce, yet they are often confused. Many Shopify founders celebrate rising sales without realizing their business is making little profit, or even losing money. High revenue looks impressive, but it does not tell you whether your business is financially healthy.
Understanding the difference between revenue and profit changes the way you make decisions. It helps you price products correctly, control costs, and focus on growth that actually improves your bottom line instead of simply increasing sales.
This guide explains the difference between revenue and profit, why Shopify founders often confuse the two, and how to track both metrics to build a more profitable ecommerce business.
WHAT YOU’LL LEARN

Revenue is the total money your store brings in before you subtract any costs. In Shopify, this usually appears as gross sales or net sales after discounts and returns. It is a measure of commercial activity, how much your customers are buying from you. What revenue does not tell you: whether the business is sustainable, whether you can afford to keep operating, or whether growth is actually making you better off. A business can grow revenue by 40% year over year and become less viable if costs grow even faster.
Profit is what remains after every cost has been paid. There is more than one way to measure profit, and using the wrong one at the wrong stage leads to poor decisions.
Metric |
What It Measures |
When to Use It |
| Gross Profit | Revenue minus COGS only | Product economics, is my pricing viable? |
| Contribution Margin | Revenue minus all variable costs | Unit economics, does each order make money? |
| Operating Profit | Gross profit minus operating expenses | Business efficiency, can I cover overhead? |
| Net Profit | All revenue minus all costs | True financial health, am I actually profitable? |
Most Shopify founders are looking at gross profit (or sometimes just revenue) when they should be looking at contribution margin and net profit. The gap between those numbers is where many businesses start making expensive mistakes.
Your Shopify gross revenue includes VAT/sales tax you collected for the government, returns you haven’t yet processed, and discounts already applied. None of that is profit. It isn’t even fully yours. Always work from net revenue, after taxes, returns, and discounts.
If your revenue grew 30% but your contribution margin dropped from 35% to 22%, you made less profit on a larger turnover. This commonly happens when brands run large promotions, increase ad spend rapidly, or take on wholesale orders at lower margin. Revenue growth without margin stability is not necessarily progress.
Meta reporting a ROAS of 4.2 means it believes your revenue was 4.2 times your ad spend on that platform. It says nothing about profit. A campaign generating $10,000 in revenue at 4.2 ROAS on a product with 30% contribution margin after all costs generated $3,000 in contribution, before subtracting fixed costs. Always convert ROAS to contribution margin before drawing conclusions.
The most financially dangerous version of this confusion: spending aggressively on customer acquisition to grow revenue, without having confirmed that contribution margin per order is positive. Scaling a business with negative unit economics makes every order worse, not better. Confirm your CM is positive before scaling.
THE GROWTH TRAP
The most common version of this confusion looks like this: revenue is growing, the founder feels momentum, they reinvest everything into ads to keep growing, and twelve months later they have tripled the revenue and half the cash. The business grew its way into a cash crisis because profit was never measured alongside revenue. This is not rare, it is one of the most common DTC failure modes.
The practical solution is to track revenue and profit at different cadences, for different purposes:
| Metric | Check When | Decision It Informs |
| Gross & Net Revenue | Daily / Weekly | Is the business generating commercial activity? |
| Contribution Margin | Weekly / Monthly | Are orders profitable? Is scaling justified? |
| CAC & ROAS | Weekly | Is marketing spent generating returns? |
| Net Profit Margin | Monthly | Is the business financially healthy overall? |
| LTV:CAC Ratio | Monthly | Are customer relationships creating long term value? |
The question that keeps both numbers honest: ‘If I double revenue tomorrow, does net profit also increase?’ If the answer is ‘I don’t know’, you need better visibility into your cost structure before making growth decisions.
Revenue is a necessary measure of whether your store is generating activity. Profit is the only measure of whether that activity is sustainable. The founders who build durable businesses are the ones who hold both numbers in view simultaneously, and who never confuse one for the other. If your weekly review starts and ends with the revenue dashboard, you are making decisions with half the information you need.
Most Shopify brands track revenue daily and check profit quarterly, if at all. The gap between those two cadences is where margin problems develop unnoticed. DataAnalyticsStack builds Financial & Profitability dashboards that show net revenue, contribution margin, and net profit by channel, by product, and by month, so you always have both numbers in view when making decisions.
Contact us today to see how your store is really performing.
A good customer LTV for a Shopify store is typically $168 over 3 years on average, with top performers reaching $250-$450 or more. Aim for at least a 3:1 LTV: CAC ratio to scale profitably.
Most business founders track revenue daily but often don’t measure how much a customer is worth over time. Without LTV, acquisition decisions become guesswork and margins quietly compress as ad costs rise. Understanding and improving LTV helps you make smarter decisions and grow more profitably
WHAT YOU’LL LEARN

Customer lifetime value (LTV) is the total revenue a customer generates across their relationship with your store. It sets the ceiling for what you can pay to acquire a customer while staying profitable.
If the average customer is worth $180 over 12 months and you spend $60 to acquire them, your unit economics work. If LTV is $80 and CAC is $65, you’re near break even on the first purchase and dependent on a second order that may not come.

LTV shows how much you can spend to get a new customer without losing money. Without it, you’re guessing on ad budgets and may be spending too much or too little. It also helps you see which channels bring valuable customers and which ones waste your money on buyers who never come back.
It also pushes you to think long term. Instead of chasing quick sales, you start focusing on keeping customers and getting them to buy again. If your LTV is less than three times what you spend to acquire a customer, scaling ads will hurt more than help. Knowing your LTV lets you grow without the guesswork.
Getting LTV right means moving beyond rough estimates and building a formula you can trust. Too many store owners grab a single number from their dashboard without understanding what sits behind it.
A proper calculation gives you a solid foundation for every customer acquisition and retention decision you make. To calculate customer LTV, follow these steps:
Most eCommerce teams settle on a 3 year revenue window because it balances long term insights with practical data availability. Shorter windows undercount value; longer ones introduce too much uncertainty.
Customer LTV formula is:
LTV= Average Order Value x Purchase Frequency x Customer Lifespan
Here’s what each part means:
This structure shows exactly which variable is dragging or driving your number.
Quick example,
Let’s say your store has three numbers:
Your LTV would be: $80 x 2.5 x 3 = $600
This means the average customer brings in $600 over their connection with your store. Now you know how much you can spend to acquire them and make a profit.
Beneded averages hide your best and worst performers. Pull LTV separately for paid search, paid social, email, organic and affiliates. You’ll often find one channel delivering twice the customer value of another at similar CAC.
Make sure your Customer Acquisition Cost (CAC) is recovered within a reasonable window, typically 3-6 months for direct to consumer brands. If payback beyond that, cash flow tightens and scaling becomes risky, even with strong long term LTV.
Average Customer LTV by Shopify Industry (2026)
Average LTV varies significantly by what you sell. A supplement brand with a 90 day replenishment cycle will naturally generate higher LTV than a furniture brand where customers buy once every few years. The benchmarks below use a 3-year revenue-based window, which is the most common standard in e-commerce.
The difference between a $90 LTV store and a $400 LTV store in the same vertical usually comes down to two things: repeat purchase rate and email marketing effectiveness. Stores with advanced email programmes see 35–45% higher LTV than those without. Email subscribers specifically average 3x higher LTV, not because email is magic, but because it keeps your brand present during the repurchase window.
You don’t need to overhaul your entire business to increase LTV. Most improvements come from focusing on a few high impact areas that deliver results over time.
Here are the 4 important ways to increase customer lifetime value:
Every dollar added to AOV compounds across every future purchase. A customer who spends $90 instead of $75 on each order generates 20% more LTV without buying any more frequently. Upsells at checkout, bundle offers, and free shipping thresholds above your current AOV are the fastest AOV levers.
The average Shopify store achieves around 1.8–2.2 purchases per customer per year. Moving that to 2.8 is worth more than a 30% price increase. Post purchase email flows, replenishment reminders, and seasonal re-engagement campaigns all drive frequency.
A loyalty programme that gives customers a reason to keep choosing you over the next competitor offer extends the active lifespan of a customer relationship. Loyalty members average 28% higher retention rates and 18% higher AOV, both of which directly increase LTV.
Email subscribers have 3x higher LTV than non-subscribers on average. Every visitor to your store who leaves without giving you their email is a customer you might never speak to again. Capture emails at every opportunity, post-purchase, exit intent, and during promotions.
LTV and CAC are two separate numbers that work together to show your store’s health. LTV measures customer value, while CAC measures acquisition cost. The ratio between them tells you if your growth is profitable or burning cash.
| Aspect | LTV (Customer Lifetime Value) | CAC (Customer Acquisition Cost) |
| What it measures | Total revenue a customer brings over time | Cost to acquire one new customer |
| Formula | AOV x Purchase Frequency x Customer Lifespan | Total Marketing Spend ÷ New Customers Acquired |
| Focus | Customer value and retention | Marketing efficiency and spend |
| Goal | Increase through repeat purchases and loyalty | Decrease through better targeting and conversion |
| Time frame | Long term (months to years) | Short term (per campaign or period) |
| What it tells you | How much a customer is worth to your business | How much you pay to bring that customer in. |
The ratio shows how your customer value compares to your acquisition cost. A healthy ratio is 3:1 or higher, meaning each customer is worth at least three times what you spent to acquire them. If your ratio falls below 2:1, you are likely spending too much on acquisition or not earning enough from each customer over time.
LTV is the compass for profitable growth. Many Shopify brands leave meaningful LTV untapped, not due to weak products, but due to gaps after the first purchase. A disciplined email program, a straightforward loyalty structure and clear LTV by channel will raise customer value faster than any acquisition tactic.
DataAnalyticsStack builds Customer Analytics dashboards that track LTV, retention, and repeat purchase rate in one place. You’ll see which customers to acquire more of and which channels are actually profitable.